Everything Except My Mortgage Blown Away
From Auckland, to London, to Ottawa, central banks raised overnight rates in a race to restore price stability and their own credibility. Stocks, bonds, crypto, real estate – if you owned it, it went down in value in the first half of 2022. If you borrowed money to leverage your way into greater wealth, your banker wants to speak with you. Rarely have so many, lost so much, so quickly.
Supersize Me
Government bond yields rose substantially in the first half of the year in the face of runaway inflation. The Bank of Canada continued its battle against inflation, raising its target interest rate by an eye-popping 100 basis points (bps), or 1.0%, on July 13th. The Bank’s overnight rate stands at 2.5%, which is 2.25% higher than the beginning of the year. On July 21st, the European Central Bank raised rates 50bps, double what they promised just a few weeks ago, and the first policy increase by the ECB in over a decade. This coming Wednesday, markets expect the Fed to raise rates 75bps, taking the U.S. overnight rate on par with Canada.
On the heels of the Bank of Canada’s hike, the Canadian yield curve inverted, as 2-year bond yields rose while 30-year yields fell. The yield curve inversion indicates real concerns that higher interest rates will slow economic activity. The market is also placing a high degree of confidence that central bank actions will wrangle inflation back to target.
The Bottom Line
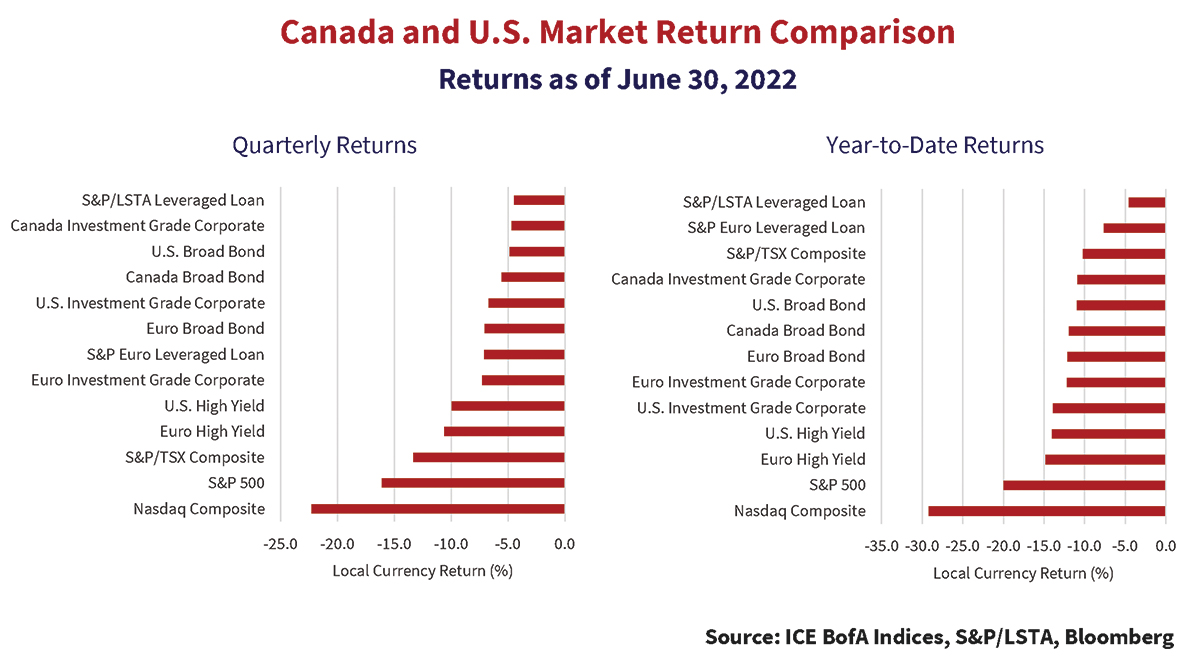
The first quarter financial market bruising exploded into full blown carnage by mid-year as second quarter returns pushed deeper into negative territory. The charts below highlight second quarter and year to date performance. Several markets recorded double digit losses, as investors fled the riskiest assets. Equity markets, followed by high yield bonds, posted the largest drawdowns.
Investment grade markets saw wider credit spreads add to the devastation caused by higher government bond yields. At -4.7%, the shorter duration Canadian Investment Grade Corporate Index outperformed its U.S. counterpart, and the Broad Bond Indexes in both markets. Positive relative performance is unlikely to provide consolation to absolute return investors down over 10% so far in 2022. Year to date, the S&P/TSX return stands out relative to the other equity markets due to strong performance from its oil and gas sector, while on the other end, the Nasdaq has been adversely impacted by plummeting prices in technology stocks.
Leveraged loans weakened into quarter-end but remained the top performing fixed income asset. The siren call of floating rate coupons and first lien security drove leveraged loan market demand as well as ongoing demand from CLOs.

Tough All Over
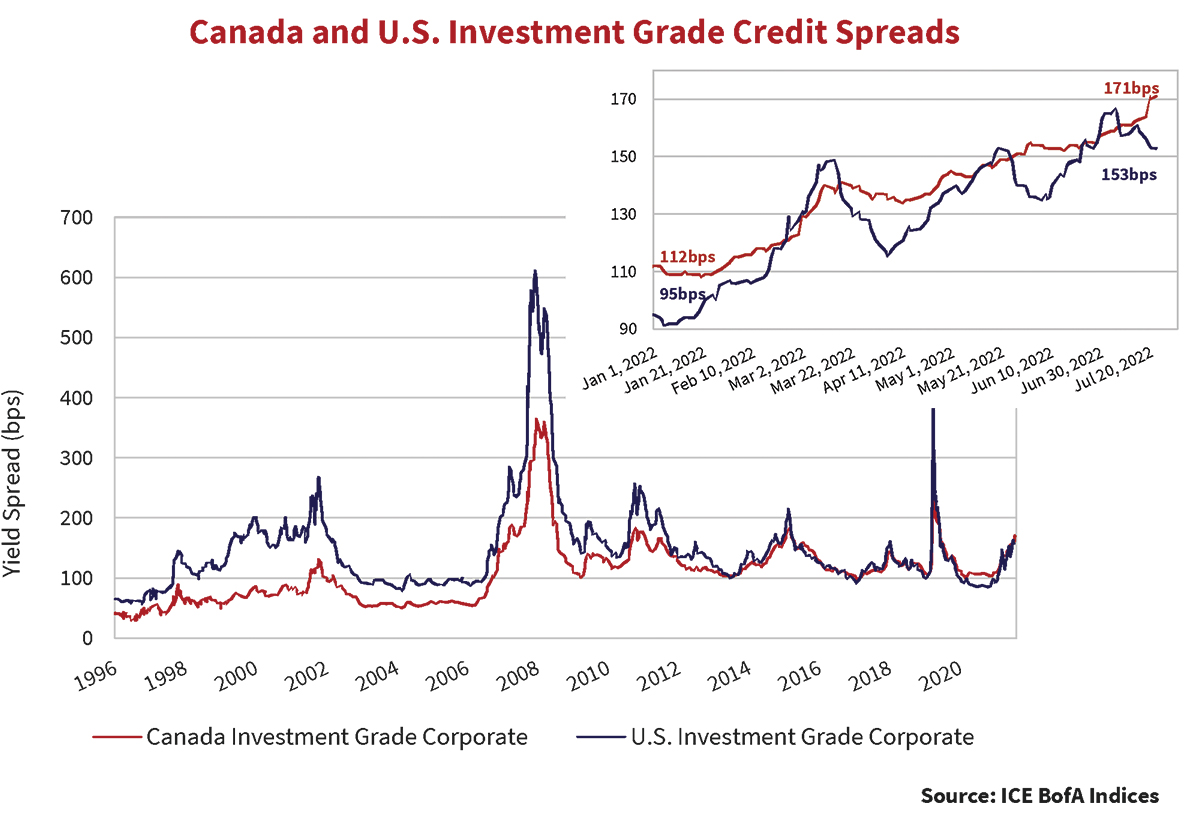
Investment grade credit spreads widened in the second quarter. In Canada, higher quality spreads climbed 21bps, while the U.S. saw a 42bps increase. The graph below plots historical credit spreads of the ICE BofA Canadian and U.S. Investment Grade Corporate Indexes. Spreads in both markets moved substantially higher year-to-date. U.S. investment grade spreads now sit just above their long-term average of 147bps. Canadian investment grade spreads are 63bps above.

In the second quarter, U.S. BBB corporate spreads moved 54bps wider, compared to 34bps in higher quality A-rated issues. In Canada, BBB and A-rated spreads both widened similar amounts, 19bps and 24bps, respectively. Canadian banks flooded the new issue market with product and investors demanded new issue concessions. This pushed new issue and secondary spreads wider. Limited Recourse Capital Notes (LRCNs) issued by the Canadian banks ranked among the worst performing securities in the Canadian market. LRCNs are not a constituent of the Canadian Index.
Just Can’t Get Enough
Year-to-date, Canadian investment grade new issue volumes lagged 2021’s record setting pace only slightly. Canadian banks were the most active, issuing domestically and globally. TD Bank issued $2.75 billion five-year bail-in bonds at a spread of 163bps. BMO followed suit at a spread of 165bps. June brought a series of LRCN issuance totaling $3.3 billion. CIBC priced $800 million at 400bps back of the 5-year Government of Canada yield. Manulife then printed $1 billion in new notes at 395bps. Finally, BNS priced the largest issue of the period at $1.5 billion, also at a spread of 395bps. Initial coupons for each of these deals exceeded 7%. The headline yield translated into significant investor demand for these issues.
Banks also continued to migrate preferred share funding away from retail to institutional investors. The Bank of Montreal recently issued a $500 million preferred share offered only to institutional buyers with a reset spread of 425bps. Proceeds were used to call a $400 million retail-based preferred share with a reset spread of 317bps. The benefits of satisfying the regulator’s desire to reduce retail funding and creating additional room for future LRCN issuance seemingly outweighed the faulty economics of the transactions.
Issuance activity by non-financials continues to be muted, as many corporate issuers shored up liquidity positions during the Pandemic at substantially lower all-in yields. Of note, TransCanada Pipelines came to the market in May in a three-tranche deal totaling $1.5 billion.
Tryin’ To Live My Life Without You
High yield new issue supply fell drastically in the first 6 months of the year. Higher benchmark yields, widening risk premiums and heightened recession worries dampened new issuance activity. In the second quarter, JP Morgan tallied only U.S. $25 billion of U.S. new high yield issuance, bringing the year-to-date total to U.S. $71 billion. This compares to U.S. $301 billion for the first six months of last year. Outside the U.S. market the same trend held, as non-USD high yield issuance fell to a U.S. $20 billion equivalent, down 80% from the same period last year.
You’re Shaking My Confidence Daily
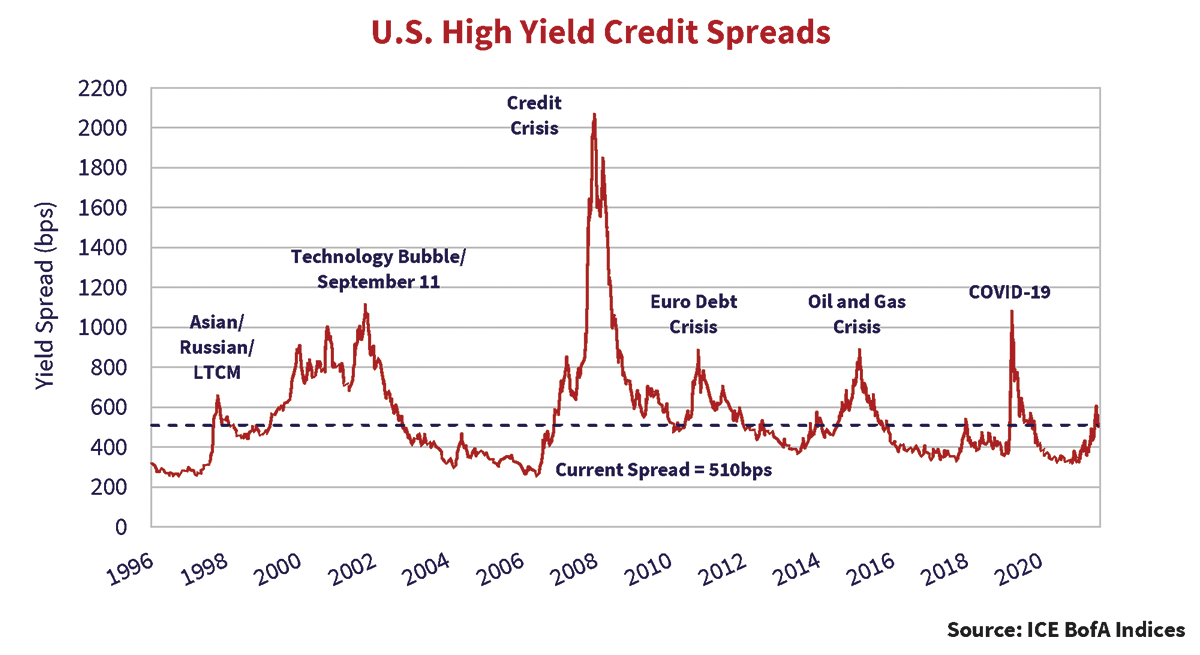
The chart below graphs the spread of the ICE BofA U.S. High Yield Index. High yield spreads started the quarter only 41bps wider than the year-end 2021 close, as light new issue supply helped to offset the market’s eroding risk appetite. Investor concerns over the fallout from aggressive central bank rate tightening took hold in the second quarter. Investors rushed to the exits pushing spreads 221bps wider to 592bps at the quarter end. This was the first close of the Index above its long-term average of 544bps since June 2020. There may be more pain to come, as high yield credit spreads still have a long way to go to reach the wide levels experienced in past crisis periods.

Lower quality issues accounted disproportionately for the shift higher in credit spreads this year. The graph below plots the difference between lower quality CCC-rated versus higher quality BB-rated spreads. Investors have fled from the uncertainty of the riskiest assets.

For Whom The Bell Tolls
Downward pressure in the lowest quality segments of debt markets should not be surprising as the most speculative issuers are starting to come up against tightening liquidity across capital markets. New issue activity can only remain depressed for so long before issuers will have to bear significantly higher refinancing costs.
We expect we are at the very beginnings of increased default activity. While still relatively modest, this year has seen the most default activity since 2020. JP Morgan calculates 9 companies defaulted in the U.S. this year totaling U.S. $17.2 billion, while another 6 companies completed distressed exchanges aggregating U.S. $9.7 billion. The tally through the first half of 2022 is nearly twice last year’s full year total of U.S. $13.9B. Endo Pharmaceutical experienced the largest default of 2022, while household name and longstanding issuer, Revlon, was also added to the list.
A Dance to the Tune of Economic Decline
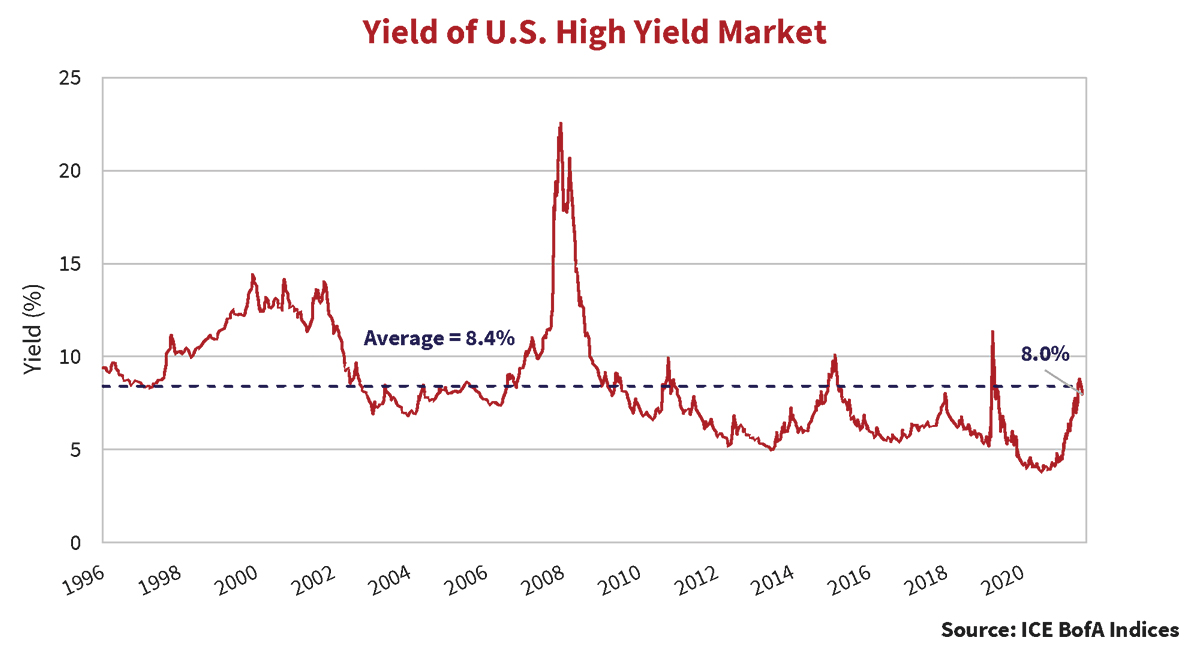
Higher treasury yields and wider credit spreads combined to push the yield to worst for lower quality credit to 8.9% on June 30th, above its long-term average of 8.4%. As the graph below illustrates, the increase has been sharp. It was just a year ago that the Index yield hit the all-time low of 3.8%. We began to observe, to our amazement, “high” yield issuance with coupons below 3% in some BB-rated issues. At that time, over 50% of issues carried a yield below 4%, while today the tally is just 0.3%. The vast majority of the underlying issues are now yielding above 6%. There is also a steadily increasing cohort of issues yielding north of 10%, which comprises just over 21% of the Index.

All in yields approaching 9% enticed buyers back to the market and high yield spreads have subsequently rallied 82bps in July. We expect July’s rally to be short-lived as reduced availability of credit, higher borrowing costs and a slowing economy take their toll on highly levered companies with flawed or strained business models.
When Times Go Bad, When Times Go Rough
Markets frequently disconnect from fundamentals. Securities achieve lofty pricing levels and remain expensive for long periods. Investors chase returns at the expense of prudence. Central bank and government policies fuel unjustified confidence and unsustainable excess. Market corrections occur swiftly and unpredictably when the previously acceptable turns intolerable. Markets lurch from crisis, to rescue, to stabilization, to recovery, then normalization.
We believe we are in the normalization phase of the latest cycle, exiting a period of extraordinary excess. Central banks are raising overnight rates and reducing bond holdings. Bond yields are jousting with inflation expectations. Risk premiums are moving higher as concerns over recession and rising corporate defaults take hold.
Higher yields and wider spreads have put the “income” back into fixed income. While the return potential afforded by credit markets is more interesting than 6 months ago, we do not believe potential returns offset the risks we see ahead. We are continuing to value quality and liquidity above all else.