

Whither inflation and bond yields? Will they wane and wither, as many expect, or will they show underlying strength and stay higher for much longer than the market consensus predicts?
Don’t Worry, Be Inflation Unhappy??
Inflation has become the variable which gives the “experts” and the markets heartburn after years of taking low inflation for granted. The “Will They, Won’t They” assessment of central bank policy and intentions are sending tremors through the global capital markets. When inflation is reported higher, central banks hike interest rates and bonds plunge, only to later rally higher in price when yields drop on confidence that the aggressive rate hikes by central banks will slow the economy and send inflation lower. Yields eventually creep back up to new highs and the cycle starts again.
The central bankers themselves are doing policy and rhetorical backflips explaining their change in inflation stance from “Don’t Worry, Be Happy” to a “Clear and Present Danger”. The latter policy requires immediate and harsh interest rate medicine targeted at “destroying demand”, aka “cratering the economy” to slow wage and price pressures. This change in tune by the central banking band is causing panic among their bond market groupies.
Inflation Bewitched, Bothered and Bewildered
Central bankers were idolized, heroized and now look to be Super-Sized in their interest rate increases. The latest song of the central banking band seems to be inflation “Bewitched, Bothered and Bewildered”, as a recent Washington Post article recounts:
“Federal Reserve Chair Jerome H. Powell acknowledged this week that there are a few things he does not know about the U.S. economy.” He doesn’t know if it is doomed to fall into recession. He doesn’t know how long high inflation will persist. And he doesn’t know if healthier supply chains will be much help. “It’s very hard to say with precise certainty the way this is going to unfold,” Powell told reporters this week. “No one knows whether this process will lead to a recession or, if so, how significant that recession would be.”” Source: Lynch, D. J. Fed unsure of economy’s direction as wall street meltdown worsens. The Washington Post, September 24, 2022.
Know Nothings
There’s a lot of “He doesn’t know” or “No one knows” in this interview so Jerome Powell and the Fed are now admitting they are only human. This seems a little familiar to us. It’s easy being in charge and taking credit when things are good. Fed Chair Alan Greenspan was called the “Maestro” after a long and stable economic period called the “Great Moderation” in the 1990s. That didn’t end so well with the 2000 Dot.com stock market crash, the 2008 Credit Crisis and the subsequent Great Recession. Greenspan is no longer considered a monetary genius and he now admits to his errors.
Where Are We, Inflation Wise??
It’s been a while since we’ve done a deep dive into inflation and bond yields. Literally, “there is no time like the present” since the uncertainty over inflation is the greatest in many years. Most active investors have only known falling inflation and bond yields, which has been largely the case for the last 41 years since they peaked in 1981. Now investors are faced with the highest inflation in 40 years, and for most, their entire investing careers. Since investors really don’t know what to think about inflation, we thought it was time to update our 2011 Canso Position Report, Canadian Inflation and the Prospects for Real Return Bonds.
Money Did End Up Mattering
As readers of our Canso Market Observers know, we watched the loosening of both monetary and fiscal policy during the pandemic with much trepidation. Our take was that too much money was being created and spent for inflation to lie dormant. As central bankers are finding out once again, at some level of monetary stimulation, “Only Money Matters”, as famous monetarist economist Milton Friedman used to say.
Fed Chair Ben Bernanke was asked during his tenure what he would do if monetary policy was “Pushing on a String”, as Keynes put it, and consumer demand didn’t respond to stimulation in an economic crisis. Bernanke mused that dropping money from helicopters would provide stimulation and received the moniker “Helicopter Ben” for his reply. Commentators were flabbergasted that a Fed Chair would even say something like that, even in jest. The problem today is that reality was not far from Bernanke’s conjecture.
Uncle Trump Bucks
This time around, there was no money creating reticence in the halls of economic power. Government fiscal policy spent the copious money created by central banks to ease the economic downside of the Covid pandemic. It took a Republican President, Donald Trump, to actually implement Bernanke’s policy. Trump didn’t drop money from helicopters, he sent it directly to all U.S. citizens, whether they needed it or not, and had his name put on the cheques when he found out he couldn’t sign them.
These “Trump Bucks” juiced U.S. consumer demand, and other developed countries joined in with their own pandemic income support programs. The problem was that this huge global monetary ease occurred just when the finely tuned international supply chain was breaking down. The pandemic support money increased demand and spending on goods with reduced supply due to pandemic shortages. Prices shot up when curtailed supply met the amped up consumer demand, as anyone who has had an economics course would expect. When 3-year-old used cars sold above their original list price during the pandemic, it was obvious that consumers were spending their pandemic “Stimmie”, as was intended by policymakers.
Lulled Into a Monetary Stupor
So how did we get here? As we’ve told you constantly in our newsletters, central bankers and financial bureaucrats were lulled into a money creation stupor since the Credit Crisis of 2008. They had taken interest rates to very low levels and even zero through conventional monetary policy for protracted periods. Since short-term interest rates were below prevailing inflation, borrowers could fund at negative real interest rates. What’s not to like about that if you’re a borrower. At the time, critics and the consensus were convinced that all the money created would lead to inflation, and it didn’t happen.
Then central bankers bought government bonds by the bucketful during the Euro Debt crisis which forced down bond market yields with Quantitative Easing (QE). This gave us a protracted period of very low bond market yields, and we still didn’t end up with the high inflation that critics feared. The European Central Bank (ECB) even created the bizarre spectacle of negative actual nominal yields, as their massive bond buying forced Euro government bond yields to negative levels in many European countries. Clearly, we were a long way from the doctrinaire monetarist “Only Money Matters”.
Make Money Popular Again??
This was obviously quite popular with politicians. More money is always more popular than less money. Who cares about a deficit if people have to pay you to hold your debt? Populist President Trump thundered that the U.S. should have negative interest rates as well, given the innate superiority of his MAGA America to the perfidious Europeans. All of this led to the clear belief among central bankers and economic policy makers that a country could create as much of its own currency as it wanted, with no dire inflationary consequences. This became known as Modern Monetary Theory (MMT). This loosely translated as “Get Money Happy” and produce as much of it as you want. Then came the pandemic.
Temporarily Confident
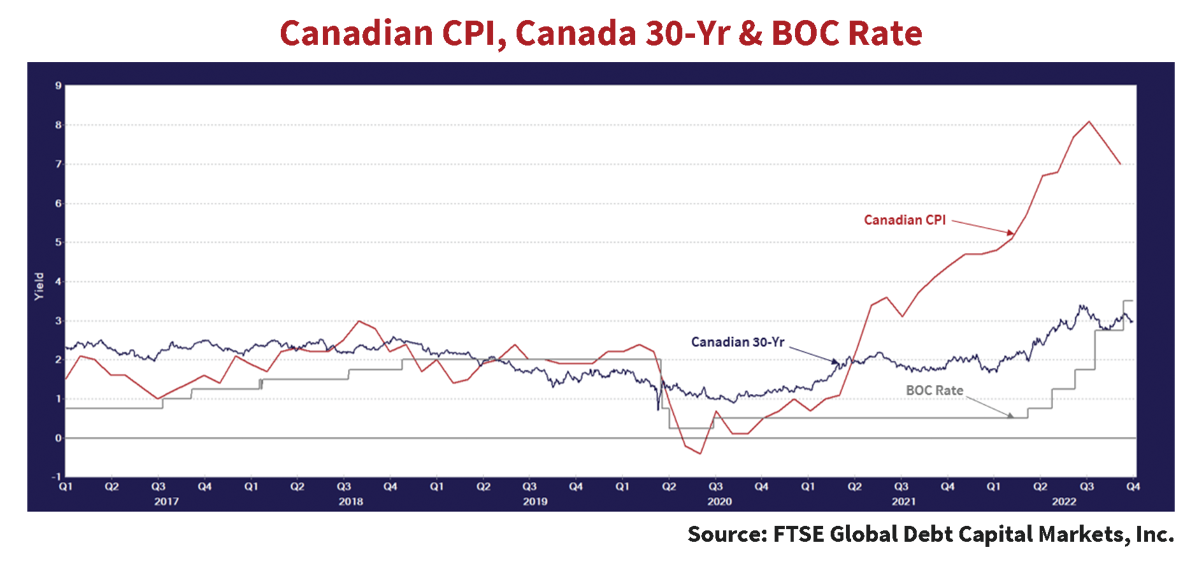
Since we are based in Canada, we’ll look at Canada’s recent inflation experience. The Bank of Canada (BOC) and most other central banks were supremely confident that the inflation coming out of the pandemic resulted from “temporary” price shocks due to supply chain disruptions, until they weren’t. As the chart below shows, the year-over-year Canadian CPI had fallen to -0.4% in Q2 2020, as Covid lockdowns caused demand to drop precipitously. It recovered to the BOC target of 2% by Q1 2021 with the stimulation in demand from the Covid support programs and very loose monetary policy. The BOC then continued to keep monetary policy loose, despite rising inflation after the pandemic, expecting it to soon fall. The bond markets agreed, and 30-year bond yields stayed anchored at the very low levels of the pandemic for quite some time, as can be seen in the chart below. Even now, with inflation at 7.0%, the 30-year Canada bond has fallen back to around 3%, on the hopes of falling inflation and yields, after peaking at 3.4% during the worst of the market inflation fears.
In the Fed They Shouldn’t Trust
The chart also shows how late the BOC and other central banks were in finally tightening monetary policy. Note that inflation had moved above the BOC 2% target in Q1 2021, but the BOC did not tighten until a year later in Q1 2022. By that time, the CPI was already at 6%. This proves our frequent newsletter point about what we called the consensus “Command and Control” belief in central banks, which posits they always get things just right by brilliant monetary policy moves, based on extensive research and information. We believe skeptically, and perhaps jadedly, that central banks are just a collection of human beings who inevitably tighten late and end up overtightening by quite a margin as their public moves from “don’t cause us pain” to “you were asleep at the switch”.
Global financial markets are now gyrating between inflation reports and U.S. Federal Reserve meetings. The current consensus is really “In the Fed We Trust”, believing that the Fed and the BOC will get inflation snappily back to 2%, in a lickety-split way. How do we know this?? It Is quite easy since inflation-linked bonds became part of the bond markets.
Yield to Inflation
Inflation-linked bonds, the Canadian Real Return Bond (RRB) and the U.S. Treasury Inflation Protected Security (TIPS) now allow us to directly estimate the future inflation that investors impound from bond yields.
It was boring old Canada that developed today’s most widespread inflation-linked model with its first RRB in 1991, the 30-year 4.25% of December 2021, that just matured. The Canadian model was far simpler than the first, but complicated British inflation-linked bonds or “Linkers”, issued by PM Margaret Thatcher to restrict future British governments from inflating away their debt. The U.S. adopted the Canadian model with minor tweaks for their TIPS and many other countries followed suit.
The Real World
The RRB used conventional bond mathematics to have a “Real Price” and “Real Yield”, with a “Real Yield to Maturity” calculated on the same basis as a normal bond Yield to Maturity (YTM). The RRB mechanics worked identically to nominal bonds and traded very much like normal bonds, except for adjusting the principal for the intervening inflation. The inflation between the time of issue applied to the original principal amount with an “Index Ratio”, indexing both the semi-annual interest payments and principal to the CPI.
The chart below shows the growth in the Inflation Adjusted Price and the Real Price of the Canada RRB 4.25% that was issued in November 1991 and matured in December 2021. An investor “buying and holding” this bond would have received $172 at maturity for the $100 she paid at issue. Note that the coupon is calculated on the inflated principal, so the semi-annual coupon also climbed by 72% from $2.125, half the original 4.25%, to $3.66 for the last coupon payment at maturity.
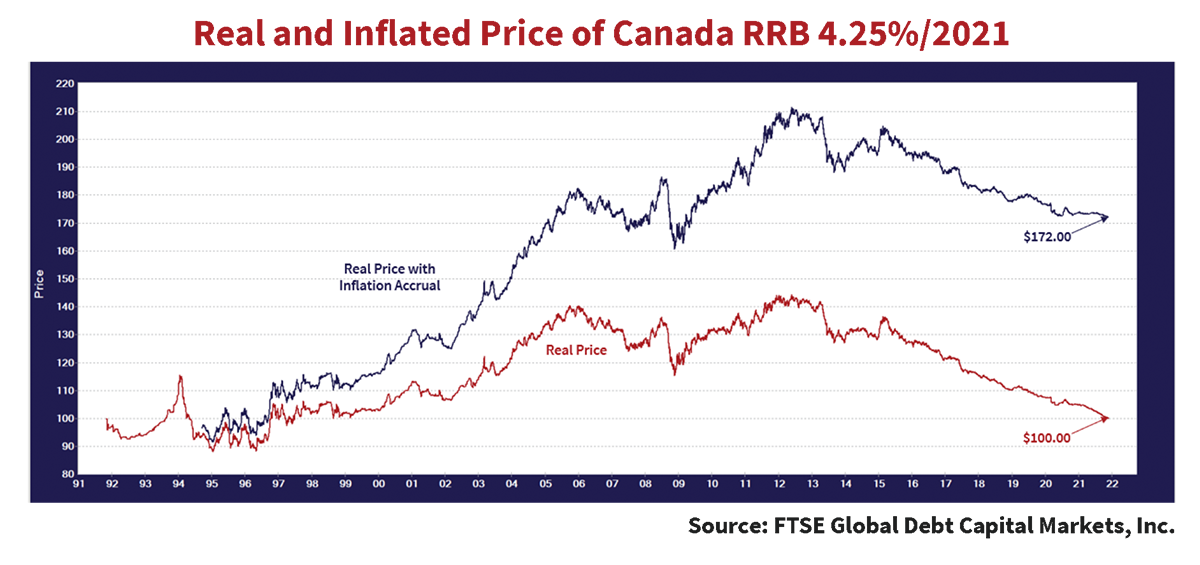
This chart shows very vividly that investors in Canada and many other countries now have a choice between buying inflation-linked bonds that provide complete inflation protection, at least based on the published CPI, or taking their chances that inflation will remove their purchasing power. The investor who bought and held the nominal Canada 9.75% of 2021 received only $100 in principal at maturity, compared to the $172 that the RRB holder received at maturity. The purchasing power in today’s terms of each of those 1991 investments is $58, only 58% of the purchasing power of the original dollars invested.
Breaking Inflation Bad
The difference between the yield of an RRB and a conventional “nominal” Canada is called the Break Even Spread (BES). If the Canadian bond market is efficient, then the inflation that investors expect over the remaining maturity of these bonds cannot be higher than that. If it were, investors would arbitrage these bonds’ yield higher and lower.
For example, the current yield on the nominal Canada 8%/ 2027 is 3.3%, and the Canada RRB 4.25%/ 2026 is 1.5%. The difference is 1.8% which can’t be higher than the market’s estimate of inflation. If investors believed that inflation was going to be 4%, they would pile into the RRB to get a total return over the period of 5.5%, not the lower 3.3% of the nominal bond. They would sell the nominal bond to buy the RRB, driving down the RRB yield and up the nominal yield, until the difference was 4%. If the RRB fell to 1% and the nominal bond rose to 5%, the difference would be the 4% BES.
Getting the BES Inflation Estimate
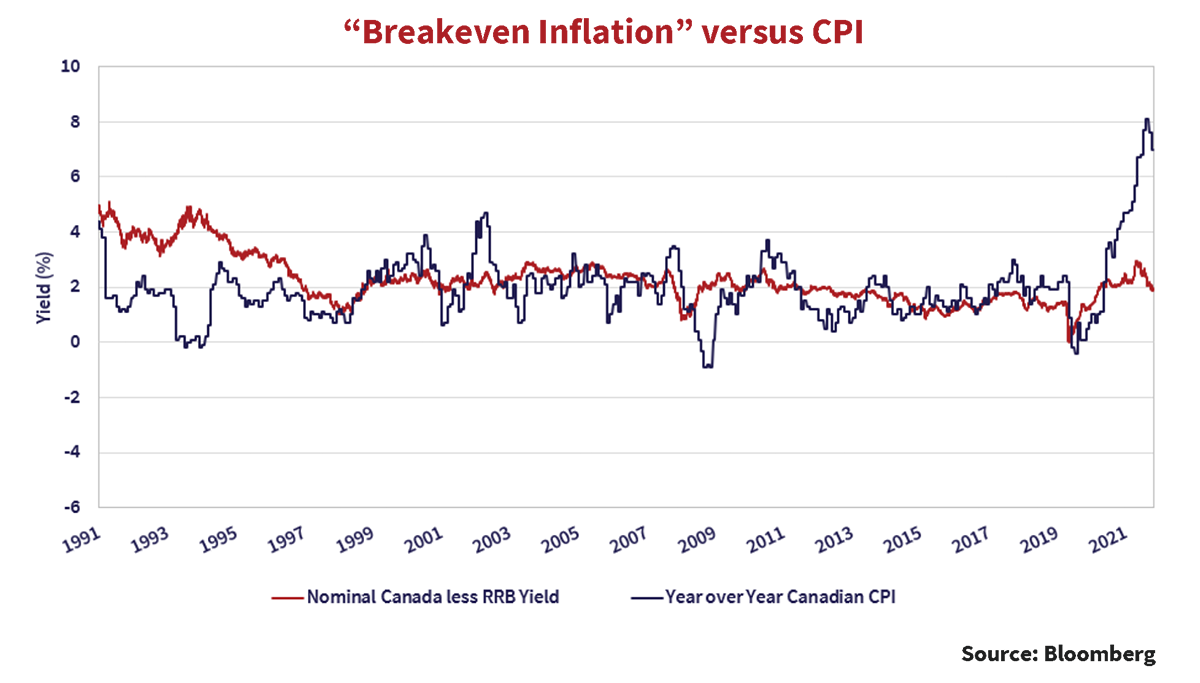
Even so, we can get a very good approximation of inflation expectations from the BES. We can see this in the chart above that shows the BES on the Canada 9.75%/ 2021 versus the Canada RRB 4.25%/ 2021 for the period until December 2019 and then the BES between the Canada 8%/ 2027 and the Canada RRB 4.25%/ 2026 until now. In the early years, the BES was above actual inflation, as bond investors remembered vividly the period of the 1970s when inflation devastated the value of their bonds.
In 1999, the BES moved to the 1-3% range of the Bank of Canada (BOC) inflation target and has stayed there. The average annual Canadian CPI over this period was 2.1%, showing that investor confidence in the BOC was well founded.
The Inflation Confidence Game
The shorter-term chart below of the BES between Canada 8%/2027 and the RRB 4.25%/ 2026 shows what happened during the Covid pandemic. In the depths of the pandemic shut down, the actual YOY CPI fell to -0.4%, and the BES bottomed at 0%. The BES rose to 1.4% in the 3rd quarter of 2020, leading actual inflation, which only rose to above 2% in the 1st quarter of 2021. By the 2nd quarter of 2021, actual inflation crossed over the BES predicted inflation at 2.1%. Then the significant departure of actual inflation to much higher levels began, with the predicted BES inflation topping out at 2.9% in Q2 2022, lagging actual inflation that surged to 8.1% by Q3 2022 before falling back to 7.0% recently.
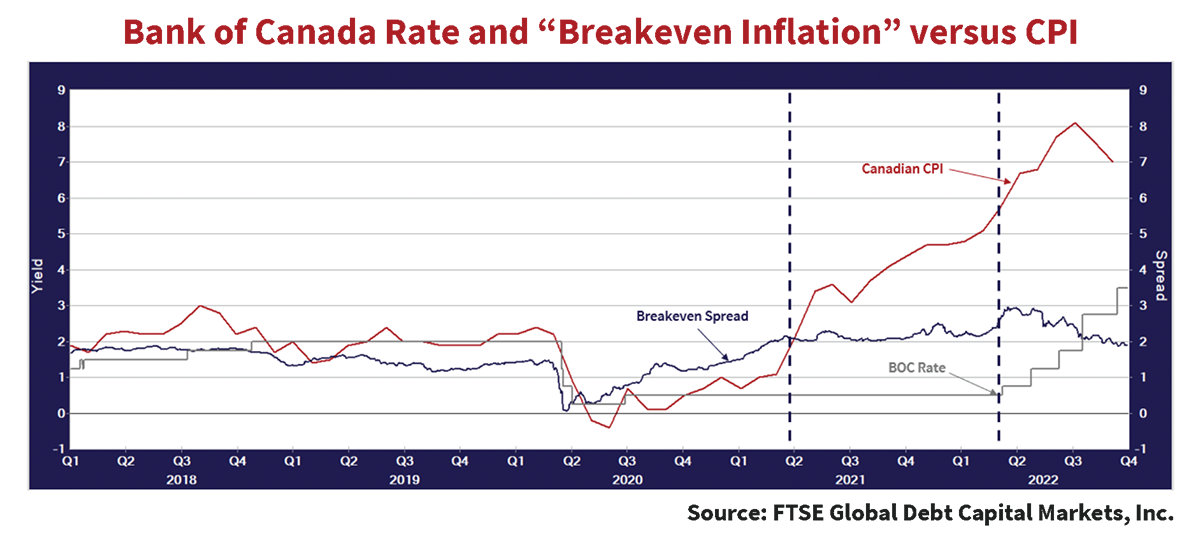
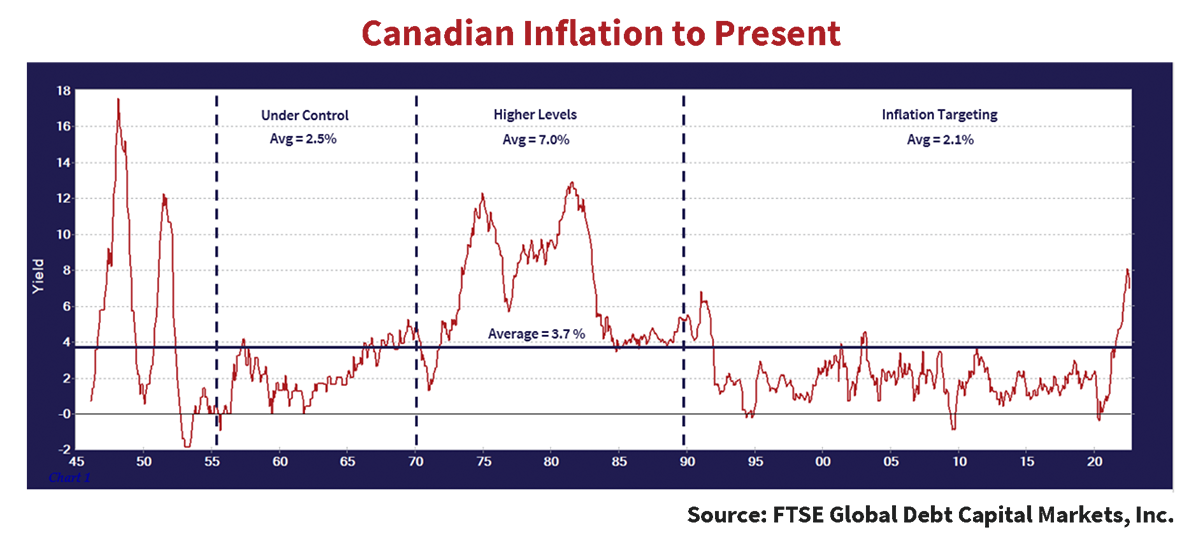
The Canadian bond market still seems to have great confidence in the BOC’s ability to manage inflation back to its 2% target. The predicted BES inflation trended down coincident with the first BOC rate hike in Q2 2022 and has since trended down to the current 1.9%. The real question is whether this stalwart belief in the BOC’s ability to contain inflation is justified. For the answer, we need to examine history, particularly the very high inflation periods that Canada has experienced. The graph below shows that Canadian inflation has averaged 3.7% since 1945, but the periods are very distinct given the macro-economic conditions of each period. Interested readers will find much more detail on these in our 2011 Position report.
Post War Inflation Spike
Most investors are surprised at the huge up and down changes in inflation in the immediate post WW2 period. This saw surging demand and limited supply of consumer goods and gives some insight into our current situation. The government directed Canadian wartime economy had wage and price controls with forced savings. Turning it into a free market civilian economy was unprecedented. Canadian inflation jumped from zero to 18% in two years on the massive demand from demobilized military personnel. They and the wartime civilian defence labour didn’t have their wartime jobs, but they had five years of savings to spend, and they did. The pandemic savings during the Covid lockdowns is an interesting parallel.
Canada then saw inflation fall to zero in the next two years, as the newly created industrial manufacturing base was turned to consumer production. Economists differentiate between the long and short term in terms of being able to adjust productive capital, and this is a great example. Factories were retooled and the 2 million returning soldiers, sailors and airmen, a huge portion of the then Canadian population of 15 million, went back to new productive civilian careers. They also had government support programs to buy houses and receive education and training. Household formations soared as marriages resulted in Baby Boom children who are only now retiring.
Galloping Out of the Inflation Stable
Things stabilized by 1955, and inflation stayed reasonably low and averaged 2.5% through the 1960s to 1970. It was the 1970s that saw much higher inflation, largely due to monetary stimulus during the Oil Shock, the Arab oil embargo on Western countries as a result of their support for Israel during the 1973 Yom Kippur War. We think this is the best period for comparison. The post WW2 period saw huge demand and rising prices due to limited supply, but the Bank of Canada did not vastly expand money supply as they did in the 1970s and recently during the pandemic.
The 1973 “exogenous shock” of oil prices spiralling from $2 a barrel to $25 slammed the brakes on the “gas guzzling” energy dependent Western economies. The Western central banks, including the BOC, loosened monetary policy to respond. The problem was then, as is now, that more money is always more popular than less money, and the expanded money supply was not curbed substantially after the oil shock permeated through the economy. Voters and the politicians they elected liked deficit financed spending programs. This led to very persistent inflation.
Real Unusual
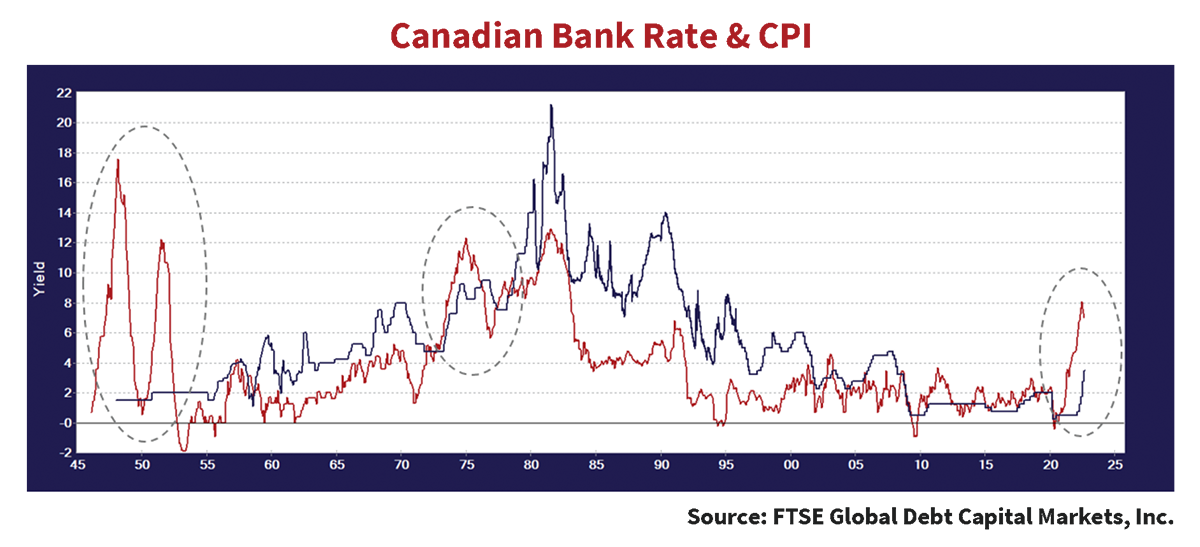
At 3.25%, the BOC rate is -3.75% below the current 7.0% CPI. The chart above shows just how unusual it is in Canadian economic history to have the CPI so far above the BOC rate, or conversely such a negative real BOC rate. We have shown these periods by the dashed circles. Excluding the 1945-55 period when inflation soared to much higher levels than the BOC rate, the only period that comes close to our current situation is the very inflationary 1970s, after the Oil Shock of 1973. During this period, the U.S. had gone off its convertibility to gold, which sent the currency markets into disarray. Canadian inflation rose from a 2% level to 4%, along with the higher levels in the U.S. during the Vietnam War and dropped back to 2% as it was winding down in 1971.
Positively Negative!
The big difference was that the BOC rate was quite positive in real terms during that period compared to negative for our current period. Before the 2020 pandemic, we had seen a long period of monetary ease, since the Credit Crisis of 2008, as we noted earlier. The real BOC rate (less CPI) averaged 2.2% in the 12 years from 1960 to 1972. In the period from 2007 to 2019 before the pandemic, the average real bank rate averaged -0.3%, which was the largest sustained monetary ease in modern Canadian history.
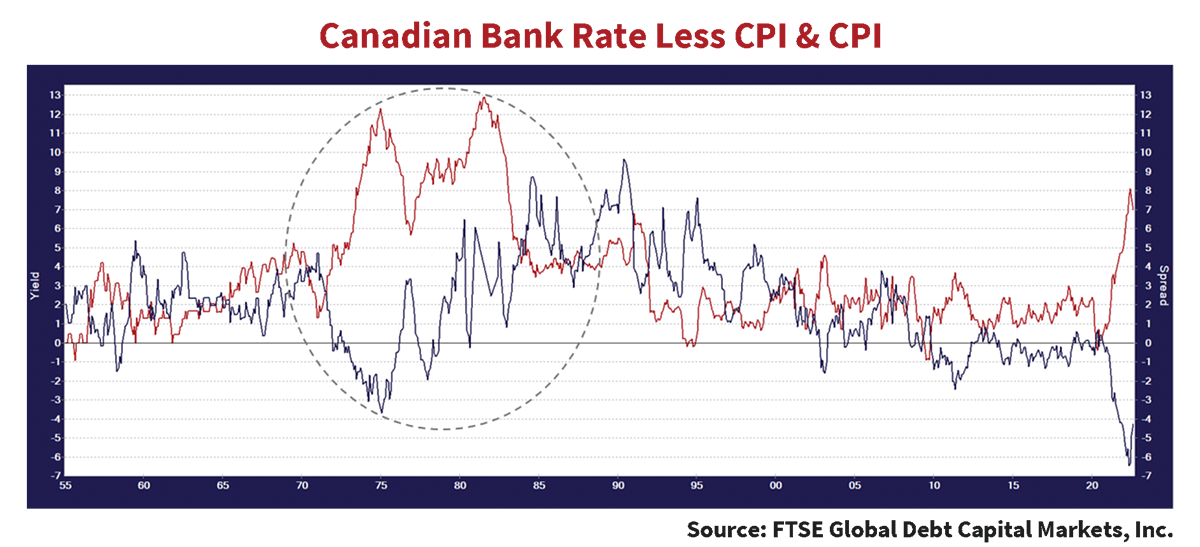
We have plotted the real BOC rate from 1955 to the present, versus year-over-year Canadian CPI in the chart above. This chart shows very graphically the difference in the real rate environment. Going into the Oil Shock of 1973, the BOC Rate had not been negative since the 1950s, and that was just for a brief period. The nominal BOC Rate was 8.0% in 1970, compared to inflation of 4.8%, for a real BOC rate of 3.2%.
The BOC had dramatically dropped its rate from 8% in 1970 to 4.75% by the Fall of 1971, as the CPI dropped from over 5% to just over 1%. The CPI climbed back up to 5%, leading to a brief period of flat to slightly negative real BOC rates in 1973, just before the Oil Shock in October 1973. The BOC began to raise its rate in September 1973, before the Oil Shock, and eventually peaked at 9.25% in August 1974. The BOC “pre-emptively” lowered to 8.25% in October 1974 but then ended up raising once again to 9.5% by August 1975, just when the CPI had begun to fall. The BOC lagged the CPI over the whole period. The CPI peaked at 12.3% in December 1974 and the real BOC rate stayed negative until the CPI fell below its 9.5% rate in February 1976.
Off the Inflation Rails
The problem for the BOC was that the extensive period of negative real rates and high inflation embedded inflation expectations. The 1970s were rife with strikes and “Cost of Living Adjustments” to pay packages. Our CIO, John Carswell, remembers going off to military college in August 1973 with the Canadian railways on strike, well before the October 1973 Oil Shock. The recent deal for U.S. Railway Unions has a proposed contract with an immediate 14% wage increase and a further 10% over the life of the contract. That caught our attention, if not a sense of déjà vu for John.
The lesson of the 1970s was that it takes a long time to slow down wage and price increases once they become embedded in the economy. Wage and price controls were imposed by the Trudeau government, and they even failed to tame inflation which surged once they came off. It finally took a 21.2% BOC rate in August 1981 for the 12.9% CPI to start falling on a permanent basis.
Small Steps to a Big Problem
The chart shows that it took an increase from negative real BOC rates to the positive and very punitive 8.2% before inflation was controlled. That’s quite “Restrictive” monetary policy compared to today’s small increases. The BOC and other central banks of the 1970s didn’t want to cause severe economic damage, just like their modern colleagues, and hoped to reduce inflation by their small steps. So, the lesson of history is that it takes extremely restrictive monetary policy to reduce inflation once it gets established. As we’ve seen, the current market consensus is that the modest and small steps, at least by 1970s standards, that we are taking to control inflation are going to work. This can be seen by the drop in the BES inflation forecast of 1%, from 2.9% to the current 1.9%.
Inflation Wondering
We wonder about the market’s inflation forecast and the current level of bond yields. So, as we’ve seen, we have the most negative real interest rates since the immediate post WW2 period, but investors are convinced that things “will get back to normal” for bond yields. The question is what is normal? Investors’ experience, given that most began their careers in the persistent negative real yield environment, is probably quite biased towards lower interest rates. As we’ve said many times in our Market Observer Newsletters, it was career limiting or ending for any bond manager to aggressively shorten his or her portfolio term from 1981 until this year. So, how do we resolve this incongruity between market expectations and what will actually happen? Since we are research based at Canso, we look at the numbers.
A Real Deal
Since the issue of the first 30-year RRB, the 4.25%/ 2021, things have changed. For one thing, these 30-year bonds have now matured so we know what happened over their term. These original RRBs came at a yield of 4.25%, dropped to 3.5% and then spent the mid-1990s at 4.5% to 5%. John recalls buying RRBs at a 5.4% real yield in 1995. He tells us that at the time, nobody thought of this to be an attractive yield! As he recounts, and we’ve shown in an earlier chart, bond investors had been burnt so badly by the highly inflationary 1970s that they demanded very high real yields on nominal Canadas. In fact, the 9.75%/ 2021 had an average real yield of 6.1% over its first five years and 5.6% over its first 10 years. These extraordinarily high real yields were very stiff competition for their inflation-linked cousins and kept the RRB yields high as well.
A Real Authority??
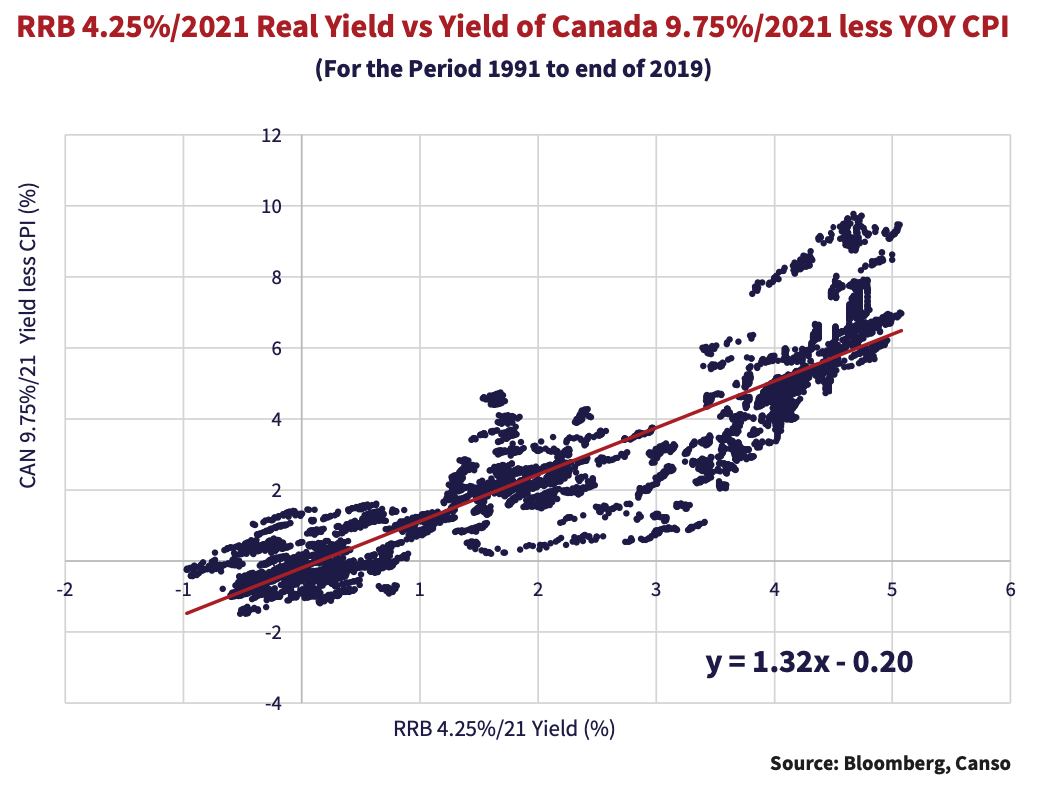
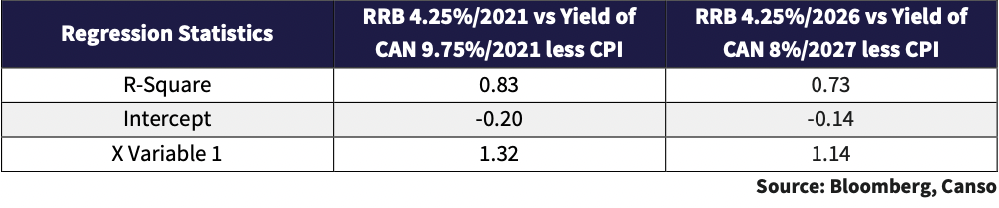
John wrote articles in 1994 on the then new and novel RRBs for the Canadian Investment Review and the U.S. Journal of Investment. From the short 3-year history of the RRBs, he concluded in the articles that the yields of the RRBs were tightly linked to nominal “real yields”. We have updated the regressions from those articles below. John’s 1994 conclusions have now proved to be the case over the whole term of this bond. Indeed, as can be seen below, the R-Squared of the regression between the real yield of the RRB 4.25%/ 2021 and the real yield of the nominal Canada 9.75%/ 2021 is very high at 83%. We also regressed the real yields of the Canada 8%/27 versus the Canada RRB 4.25%/ 2026, which was again very statistically significant, with an R-Squared of 73%. This regression period includes our current departure between the BES and inflation, so a lower R-Squared was not unexpected. Its predictive regression equation ends up with much the same result, as we can see below.
Real Passive Regressive
This now gives us the ability to divine where Canadian bond yields should be. These regressions, which are statistically significant, now give us our answer based on nearly 31 years of experience, compared to the 3 years of data in 1994.
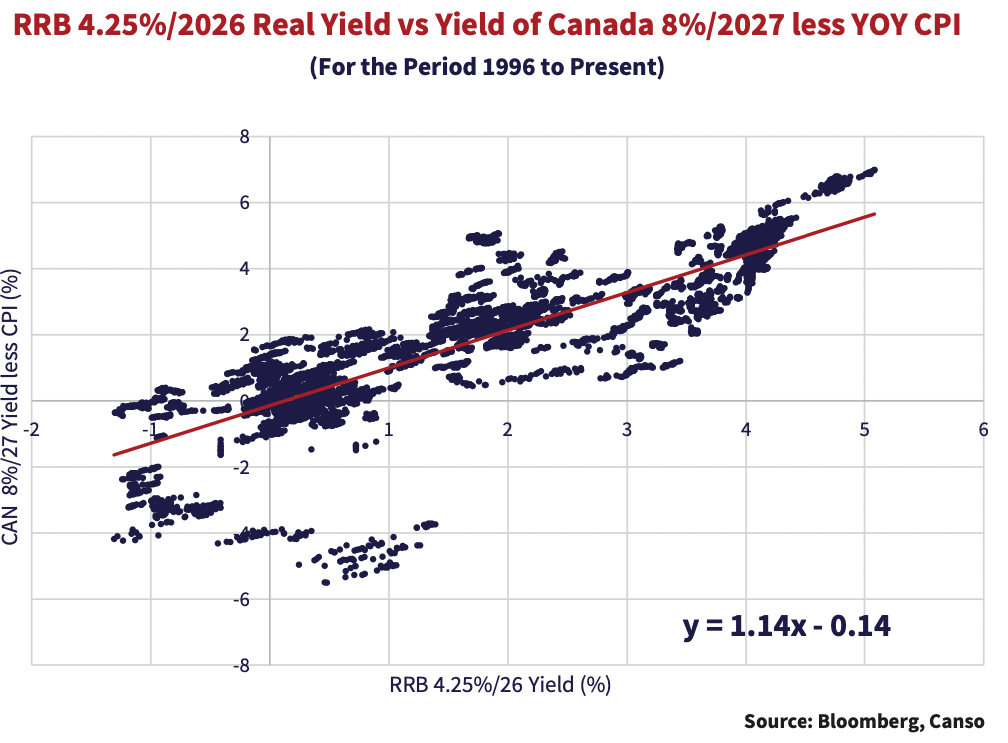
The Real Answer
The market has moved RRB yields from negative levels to above 1%, so clearly monetary tightening has raised real and nominal interest rates. The regression tables above for the 2021 and RRB gives the formula:
Real Yield on Nominal = 1.32 x RRB Real Yield – 0.20
= 1.32(1.5) – 0.20 = 1.78%
This gives us a nominal Canada 4.25%/ 2027 real yield of 1.78%, as we would expect, higher than the current similar term RRB yield. The regression for the RRB 4.25% of 2026 is:
Real Yield on Nominal = 1.14 x RRB Real Yield – 0.14
= 1.14(1.5) – 0.14 = 1.57%
This would give us a real yield of 1.57% on the nominal Canada 8%/ 2027, which is not much different than the current RRB 4.25%/ 2027 yield.
Real Valuable
What this really tells us is that investors now pay a very small premium for inflation protection. The regression of the 4.25%/ 2021 calculated a real yield of 1.78%, only 0.28% higher than the RRB yield of 1.5%. The regression of the 4.25%/ 2026 gives a nominal real yield of 1.57%, very close to the RRB yield. This doesn’t make sense to us, especially at our time of very high inflation risk and uncertainty. Inflation protection should be quite valuable, given the huge depreciation over time in the value of nominal bonds, even with moderate inflation.
The $72 principal amount advantage of the RRB at maturity was only with modest annualized inflation over the period of 1.8%. The total return of the nominal 9.75%/ 2021 was higher than the RRB at 9.75%, given its 5.5% higher coupon. Its real return over the period was 7.95% (9.75% nominal YTM minus 1.8% CPI), compared to the RRB at 6.05% (4.25% real YTM Plus 1.8% CPI).
An Unreal Advantage
The 1.9% total real return advantage of the nominal 9.75%/ 2021 results from its much higher coupon. When the RRB 4.25%/2021 was issued, the difference in coupon from its nominal equivalent was 5.5%, which was the BES and the market’s maximum inflation estimate. This reflected investors skepticism that inflation would trend lower. A 4.25% real yield was attractive and would have resulted in a superior outcome if inflation had stayed high. Today’s negative real yields for nominal bonds make the repetition of a nominal bond advantage very unlikely. Now we have RRBs with real yields of 1.5% and nominal bonds at 3.3% which puts the current BES at 1.8% and it has been dropping. Investors clearly now believe inflation protection is not required since they can buy it effectively at modest cost, but they have chosen to hold nominal bonds with the inflation risk they bear.
Missing in Real Action
We believe Canadian bond investors are making the opposite mistake that they made in the 1990s. Then, they overestimated future inflation and demanded a much higher yield than required. That wasn’t so bad a mistake at the time. They essentially blew their inflation forecast by a wide margin, but their gross forecasting error ended up very much in their favour. Now, even though we have the highest inflation in 40 years, the greatest fear of professional bond investors is missing what they believe is the inevitable rally in bonds, as has been the case for all of their investment careers. In our view, this makes RRBs incredibly cheap, with effectively the same real yield as nominal bonds. If inflation turns out to be “sticky” to the upside, there is considerable value in the no cost inflation protection from inflation-linked bonds.
An Inflation History Guided Tour
What should be the real yield demanded by a Canadian bond investor? With the current 10-year Canada yield of 3.1% and inflation at 7%, the 10-year Canada real yield is -3.9% at present. As we’ve already noted, the BES market inflation estimate is now 2%, which agrees with the consensus forecast of return to “inflation normal”. Even if the BOC is instantaneously successful in bringing inflation immediately to its 2% target, the real yield of the 10-year Canada would be 1.1%. Is this attractive for investors?? As always, we turn to history for our guide.
Accentuate the Negative
The chart below shows the real yield of the 10-Year Canada from 1945 to the present. We have shaded the area of negative yields in red.

This chart suggests to us that yields are anything but “normal”. The average real yield is +2.1% over the whole period. The real yield over the QE period since 2011 has been -0.3%.
Disinflation Desperation
Despite investor hopes and dreams of disinflation and yields plunging once again, the chart above shows that periods of negative real yields for the 10-Year Canada are very rare. The current -3.9% has been only equaled once in the almost 70 years since 1955. So, if the BOC magically waves its tightening wand and gets the CPI back to 2% tomorrow morning, the resulting 1% real yield on a 10-Year Canada bond would be low by historical standards. Hopefully, we are not reprising the bond market of 1975, which ended up with 6 years of bond investor pain and suffering as our fathers and mothers waited for the “inevitable” rally in bonds that never came. By the end of the period, battered and bruised bond investors were calling their bonds “Certificates of Confiscation” and never wanted to own a fixed rate bond again.
Inflation is Popular with Politicians
Politicians should like inflation, and that should give us pause. They are political entrepreneurs, who find fame and fortunes from their political activities. They need funds to garner the supporters they need to win office. Once in office, they control spending and tend to use government tax revenues to increase their support and chances in elections. Having rising revenues is the goal of any entrepreneur, and inflation does this very nicely for whoever is in power. Inflation also hides a multitude of budget sins.
We have been telling the readers of our newsletters for some time that the only way countries are going to reduce their debt is through the inflation of their nominal tax revenues and the reduction of the real value of their debt. We’ve seen that the mere 1.8% annualized inflation from 1991 to 2021 led to the RRB having a 72% increase in its inflation adjustment over 30 years to $172, but most government debt is not indexed to inflation.
Purging After Splurging
A recent Bloomberg Opinion article, “U.S. Is Inflating Its Debt Away After Unprecedented Spending Binge” pointed out the fact that the strong growth in U.S. nominal GDP is shrinking the outstanding debt as a percentage of GDP at the fastest rate in many years:
“For all the attention that soaring inflation has gotten this year, one of its most surprising direct offshoots has gone largely unnoticed: US government debt is shrinking rapidly. Not in dollars-and-cents terms. No, that’s growing day by day, minute by minute. But it’s dropping in the way that really matters: when measured against the inflated size of the economy.”
As Bloomberg says, this is good news and bad news:
- What It Means: The Good News This is a big break for the government and taxpayers. It makes the debt more manageable and easier to pay back.
- What It Means: The Bad News It’s lousy for bondholders. The money they’ll be repaid by the government will be worth a lot less than the money they put up.” Source: Xie, Ye. US government debt shrinks against soaring inflation. Bloomberg, September 23, 2022.
We agree with Bloomberg that governments and taxpayers should be happy at a strongly growing economy and tax revenues, but it’s “lousy for bondholders”. We wholeheartedly agree that bondholders should be “Vewy Vewy Worried” as Elmer Fudd would put it.
Right’s Deficits Aren’t Wrong Anymore
This is equal opportunity inflation. Traditionally, the right-wing lowers taxes but finds it very hard to cut spending on things that their supporters favour, like defence, so they run a deficit and borrow in the bond market. The left wing raises taxes to pay for their extensive social programs, but never enough to cover their fulsome promises, so they too, run deficits and raise money in the bond market. The innovation of the Trump Administration was that they lowered taxes and borrowed money to give it directly to voters.
Right wing or left, the political flavour of our day is populist performance art powered by divisive social media campaigns. The quest to seek attention on social media trumps anything else (joke intended) and is the modern ideology of aspiring politicians. High inflation or hyperinflation used to be the purview of left-wing crazies until Donald J. Trump came along and ran up the Mother-of-All budget deficits during the pandemic. Biden was no deficit slouch after him, and the Republicans complaining about Biden’s fiscal imprudence are trying not to laugh out loud at their sheer hypocrisy and cheekiness.
Committing Budget “kamiKwasi”
Now other populists are borrowing the winning recipe of giving away money. If you harbour any thought that politicians might reverse their fiscal stimulation, a look at Britain should put paid to that. New Conservative British Prime Minister Liz Truss’s recent mini budget pulls a Trump and gives voters relief on rising prices while cutting taxes for almost everyone and imploding the British government finances. This is about as Conservative and prudent as finances in Mugabe’s Zimbabwe or Chavez’s Venezuela. The London Times reports on what is now called, the “kamiKwasi” budget, a fusion moniker of Kwasi Kwarteng, the new Chancellor of the Exchequer, and WW2 Japanese suicide pilots:
““Friday’s resulting “mini-budget” was anything but mini. Kwarteng vowed to cut taxes by £45 billion and raise borrowing by £72 billion to fund a massive intervention to curb energy prices for families and businesses. He overturned Rishi Sunak’s national insurance rise and scrapped plans to raise corporation tax. He made homes under £250,000 stamp-duty free, a doubling of the threshold, and extended the exemptions for first-time buyers. To cap it all, the chancellor brought forward a 1p cut in the basic rate of income tax to April and scrapped the top rate of tax altogether for those on £150,000 or more. A Tory MP was heard saying “Jesus Christ” from the public gallery when the 45p additional rate was abolished…… Within minutes of Kwarteng retaking his seat in the Commons, the pound was tanking as the City reacted with alarm. Tory MPs, shocked at the decision to play into Labour’s caricature of the Tories as only there to help the rich, were openly describing it as a “kamiKwasi budget”. A former minister said: “Everyone who isn’t mad hates it.”” Source: Shipman, Tim. Yorke, Harry. Wheeler, Caroline. ‘Biscotti mini-budget’ exposes gulf between Liz Truss and Keir Starmer – and more tax cuts are on the cards. The Sunday Times, September 25, 2022.
Political “Theatre de Bizarre”
It’s one thing to see the political theatre coming out of the U.S. as Florida Governor Ron de Santis flies illegal immigrants to Democratic cities to seek attention and social media fame. It’s another when the British Parliament, the cradle of Western democracy, has similar shock theatrics for their supporters that could implode the whole British economy. Truss and Kwarteng exulted in their doctrinaire “free market” budget but didn’t have much time to celebrate. The financial markets spoke quickly, driving the British Pound down to its lowest level in many years. The only Brits who were happy at the financial chaos seem to be the hedge fund managers who were short the British Pound. Experienced emerging markets portfolio managers say that the combination of Britain’s rising rates, weakening currency and loosening fiscal policy looks an awful lot like a typical emerging market economic meltdown.
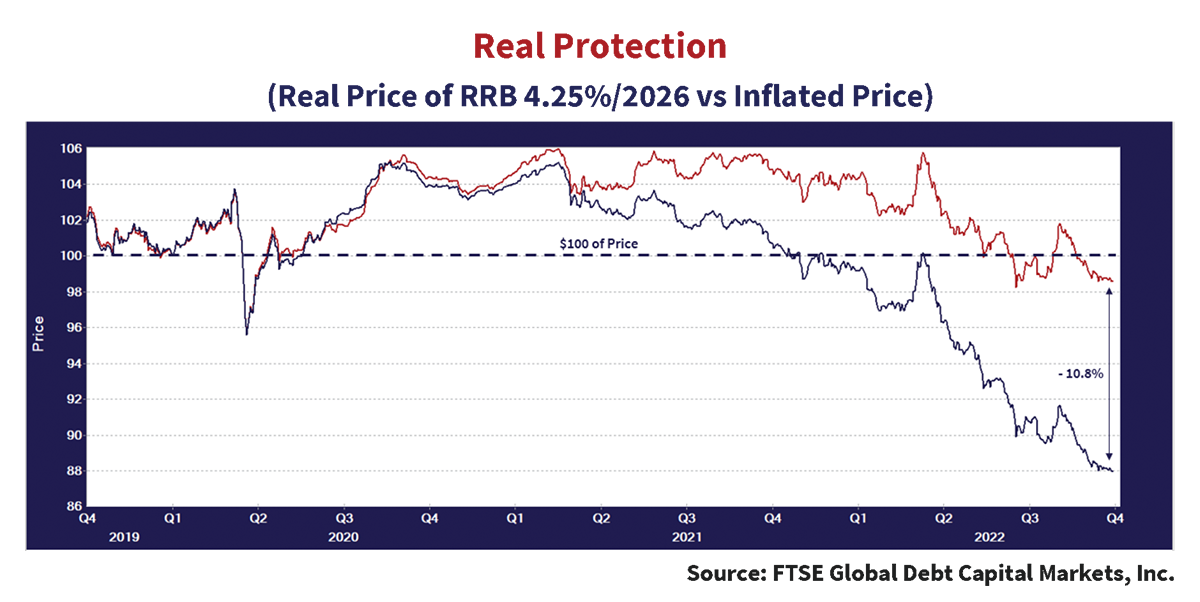
Real Protection
Despite populist politicians taking actions that add to inflationary pressures, most investors are still totally convinced that the Bank of Canada and other world central banks will succeed in their MILA (Make Inflation Low Again) crusade to lower inflation. As we see, the political risk of higher inflation to a bond portfolio is the highest in many years. What should a prudent investor do if they aren’t drinking the consensus disinflation Kool Aid?? We give the answer in the chart below. This shows the real price and the inflated price of $100 invested in the Canada RRB 4.25% of 2026 since December 2019. the most highly inflationary period in 40 years, from December 2019 to the present.
Inflation-linked by the Numbers
The 4.25% real coupon on this bond put it at a premium price of $126.99 on December 31, 2019. It fell to the current $111.69, a drop of -12.0%. This drop resulted from a 1.1% increase in its real yield over the period from 0.3% to 1.4% and an amortization of its premium price. The inflated price was $197.49, up 55% from inflation since its 1995 issue, at the start of the period and fell to $194.64 at the end of the period for a drop of -1.4%. The difference between the real and inflated price was 10.8%, reflecting the increase in the CPI over the period.
Nominally Worse
Comparison of the RRB 4.25%/ 2026 to nominal bond, the Canada 1.5% of 2026, is an interesting exercise. We have calculated the total return over the period below.
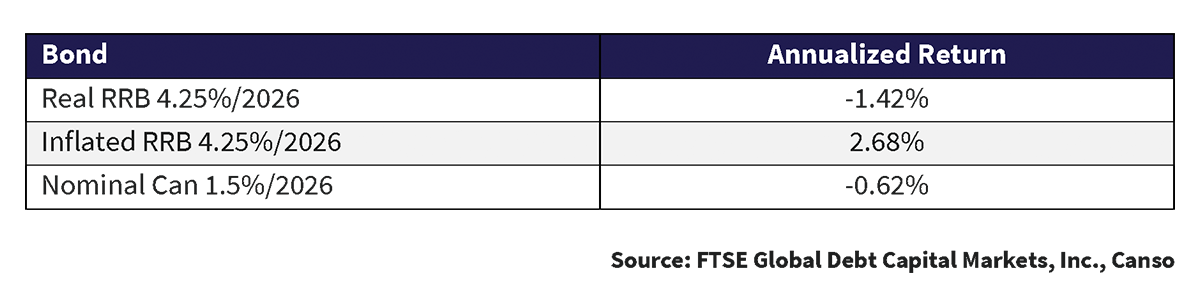
The nominal Canada 1.5%/2026 had an annualized return of -0.62% over the period, versus the -1.42% return in real terms of the RRB 4.25/2026 for the same period. The winner is the inflated nominal return of the RRB that was quite positive at +2.68%, as the 11.9% positive inflation adjustment over the period increased its return substantially.
Positively Confusing
A positive return on an RRB over the period might confuse people who follow the Canadian RRB market, which has had very negative returns thus far in 2022. At the end of August, the FTSE Canada RRB Index was -15.1% year-to-date. This is because of the steep 1% rise in its real yield, as we referred to above, and its starting long real modified duration. Investors who bought RRBs to have “inflation protection” are likely very confused and jaded by their very negative returns so far in 2022. What good is the insurance of “inflation protection” if not only it doesn’t pay off, it adds to your damage?
The steep rise in real yields from monetary tightening is to blame. This has more than offset the positive benefit from the inflation increase, which is quite a surprise to most people. Just like a normal bond, when the real yield increases, the real price drops. In the case of the FTSE Canada RRB index, the 2022 year-to-date increase in inflation of 6% was not enough to offset the drop in real price of -21.1%.
Getting Real
The chart below shows the real yield of the FTSE Canada RRB Index from its inception on December 31, 1999 to the present. The RRB real yield started out at 4% in 1999, similar to the real yield on Long Canada bonds but soon dropped. Its real yield has averaged 0.3% from December 31, 2012 to the present, higher than the real yield on the nominal Canada which was a mere 0.1%!!
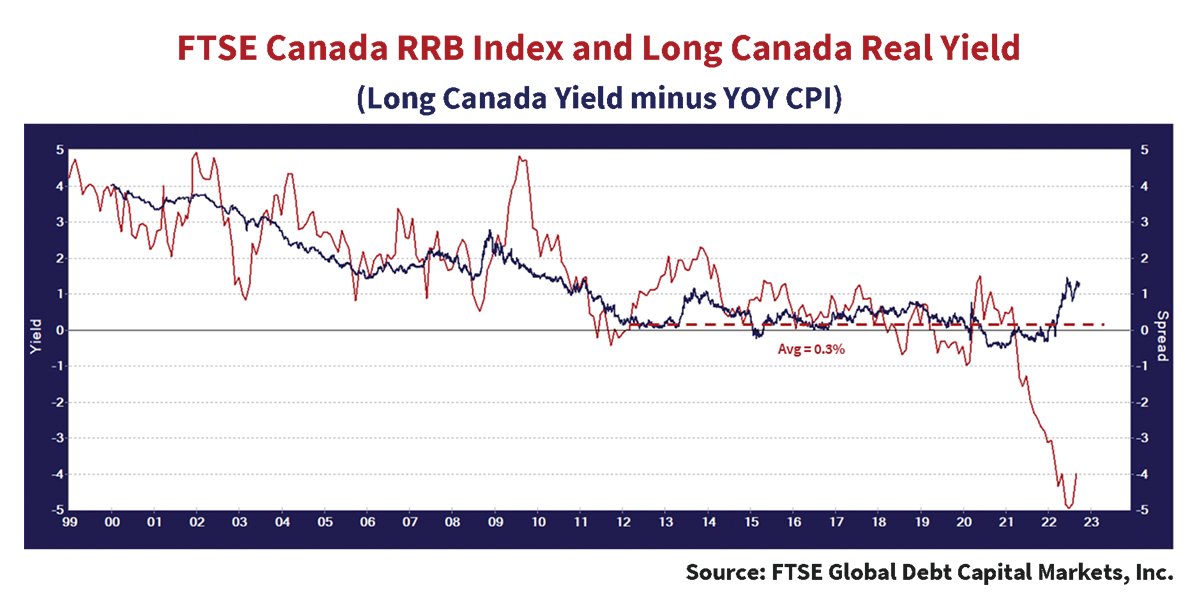
That was when we were in the thrall of the central bank MMT Fad. Now that the central bankers have been “Born Again” as doctrinaire monetarists, we’ve moved from a 0.3% to a 1.5% real yield while the real yield on the nominal long Canadas is still -4%. With the long Canada now around 3.0%, as we have pointed out, we would need a drop in inflation to 1% for the real nominal yield to be 2%, which doesn’t look likely to happen in the very near future, if history is our guide.
Get Shorty??
Inflation protection without long real duration looks attractive to us at the moment. The RRB 4.25%/ 2026 is the shortest outstanding Canadian RRB with just over 4 years until maturity. Its real price has dropped $14.5 from $126.19 to $111.69 year-to-date in 2022. Its duration is much shorter, but its high real premium price of $126.19 meant a drop in real price of $6.55 for each year of its remaining term, as well as the drop in real price due to rising real yields. Correcting by $4.91 for 9 months of premium amortization, the RRB dropped $9.59 due to the rise in its real yield, down -7.6% in real price. This was not much different than the drop of -7.7% in the nominal Canada 1.5%/ 2026 from $101.26 to $93.47. The difference is that the RRB had an increase of 6% in its value due to inflation, leading to the modest decrease year-to-date of in 2022 of -1.6%.
The Real Shame
The real shame is that we finally now have positive real yields on RRBs, after many years of low and even negative yields, but investors have been knocked to the investment mat on their existing RRB holdings. They are probably sitting in the corner of their investment rings, towels over their heads, trying to shake off the beating they’ve taken and trying to get back their investment bearings for the next round. Once you’ve been knocked flat, you’re more than a little wary about taking another pasting.
Getting Real Value
This means undervaluation and possible coming opportunity in RRBs. Investors didn’t want RRBs at 5.4% real in the 1990s but piled into them at low and even negative yields over the past few years. Now the consensus bond investor is happily buying nominal bonds at historically very low real yields. The terror of missing a rally after seeing their portfolio plunge in value so far this year creates an opportunity for those of stalwart investment heart. RRB and nominal Canada yields will rise, but a 2% yield on longer RRBs would be a very attractive proposition, with almost free inflation protection.
It seems to us that a “real opportunity” in RRBs is coming, one that won’t leave you knocked out cold on the investment mat as the performance referee calls you “down for the count”.