

A Crowded Trade – US Large-Cap Equity
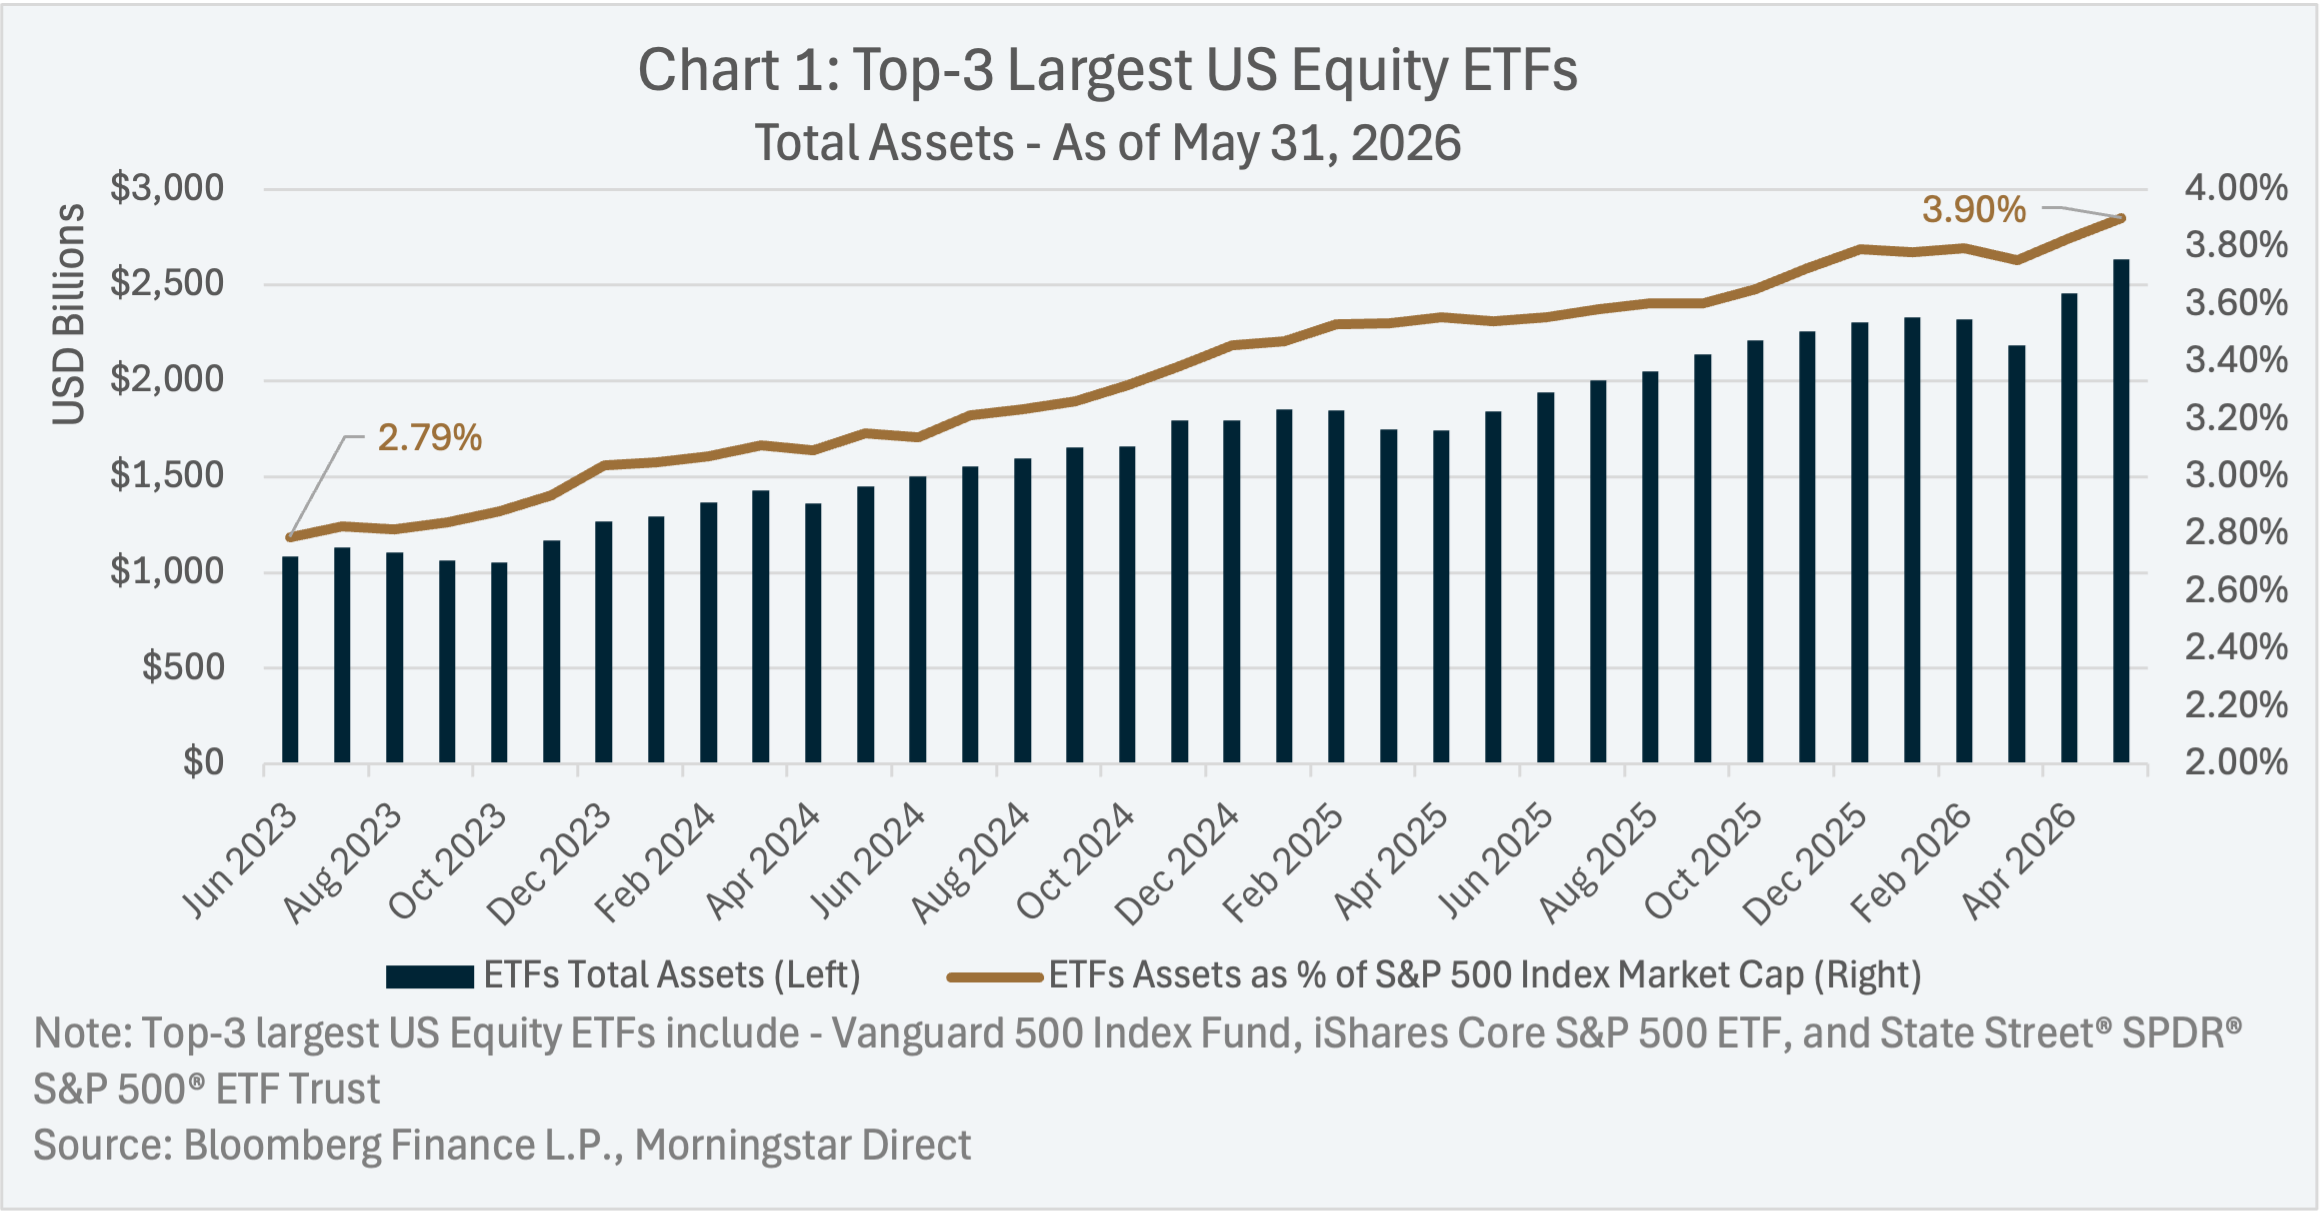
Over the past three years, US large cap equity has become an increasingly crowded trade, with investor assets growing in ETFs replicating the S&P 500 Index1. As illustrated in Chart 1, the top-3 largest US equity ETFs2 by assets (all passive ETFs replicating the S&P 500 Index) had combined total assets of USD $2.63 trillion as of May 31, 2026 – more than double the amount of assets and a greater share of total market capitalization of the S&P 500 Index compared to three years prior.
Why be Excited about US Small-Cap Equity
Allocating to US small-cap equity (represented by the S&P SmallCap 600 Index3) could enhance diversification in a portfolio heavily skewed towards US large-cap equity (such as those similar to the S&P 500 Index). Exposure to US small-cap equity can possibly reduce downside risk and enhance future returns in the event momentum in US large-cap stocks narrows or reverses.
The diversification benefits of US small-cap stocks can be demonstrated by the following factors:
- Sector Composition,
- Valuation,
- Historical Precedent.
Sector Composition: Reducing Technology Sector Concentration Risk
US large-cap equity has become concentrated to a narrow set of individual sectors and securities, while US small-cap equity is more broadly diversified.
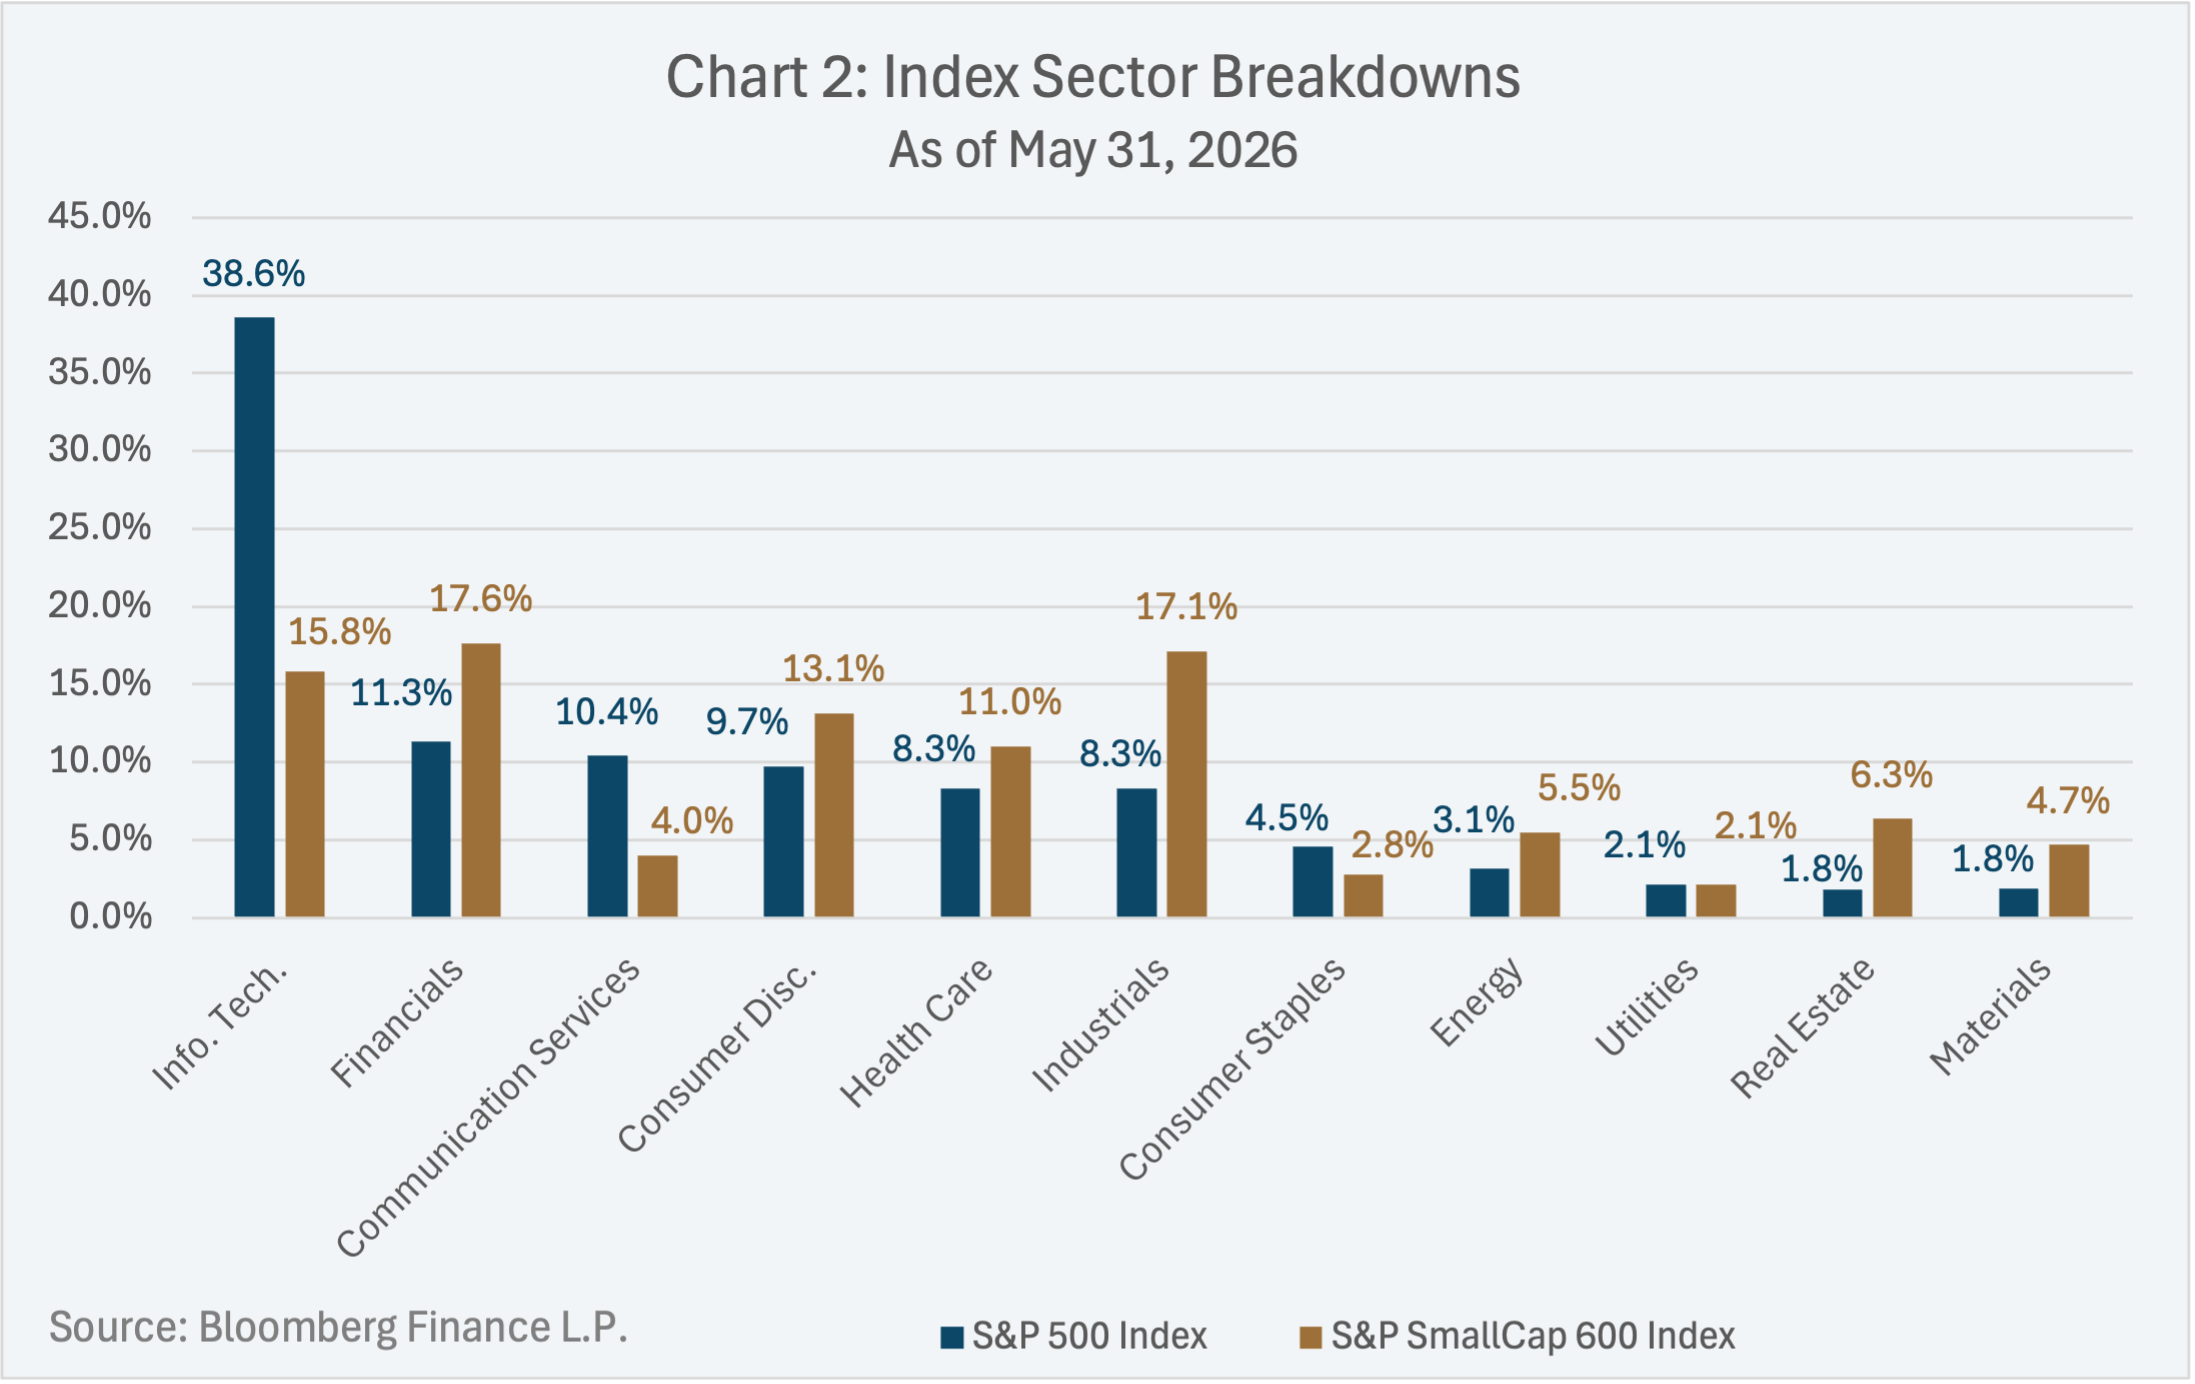
From a sector perspective (Chart 2), as of May 31, 2026, the Information Technology sector dominated the S&P 500 Index with a weight of 38.6%, while the largest sector in the S&P SmallCap 600 Index was Financials, with a weight of 17.6%.
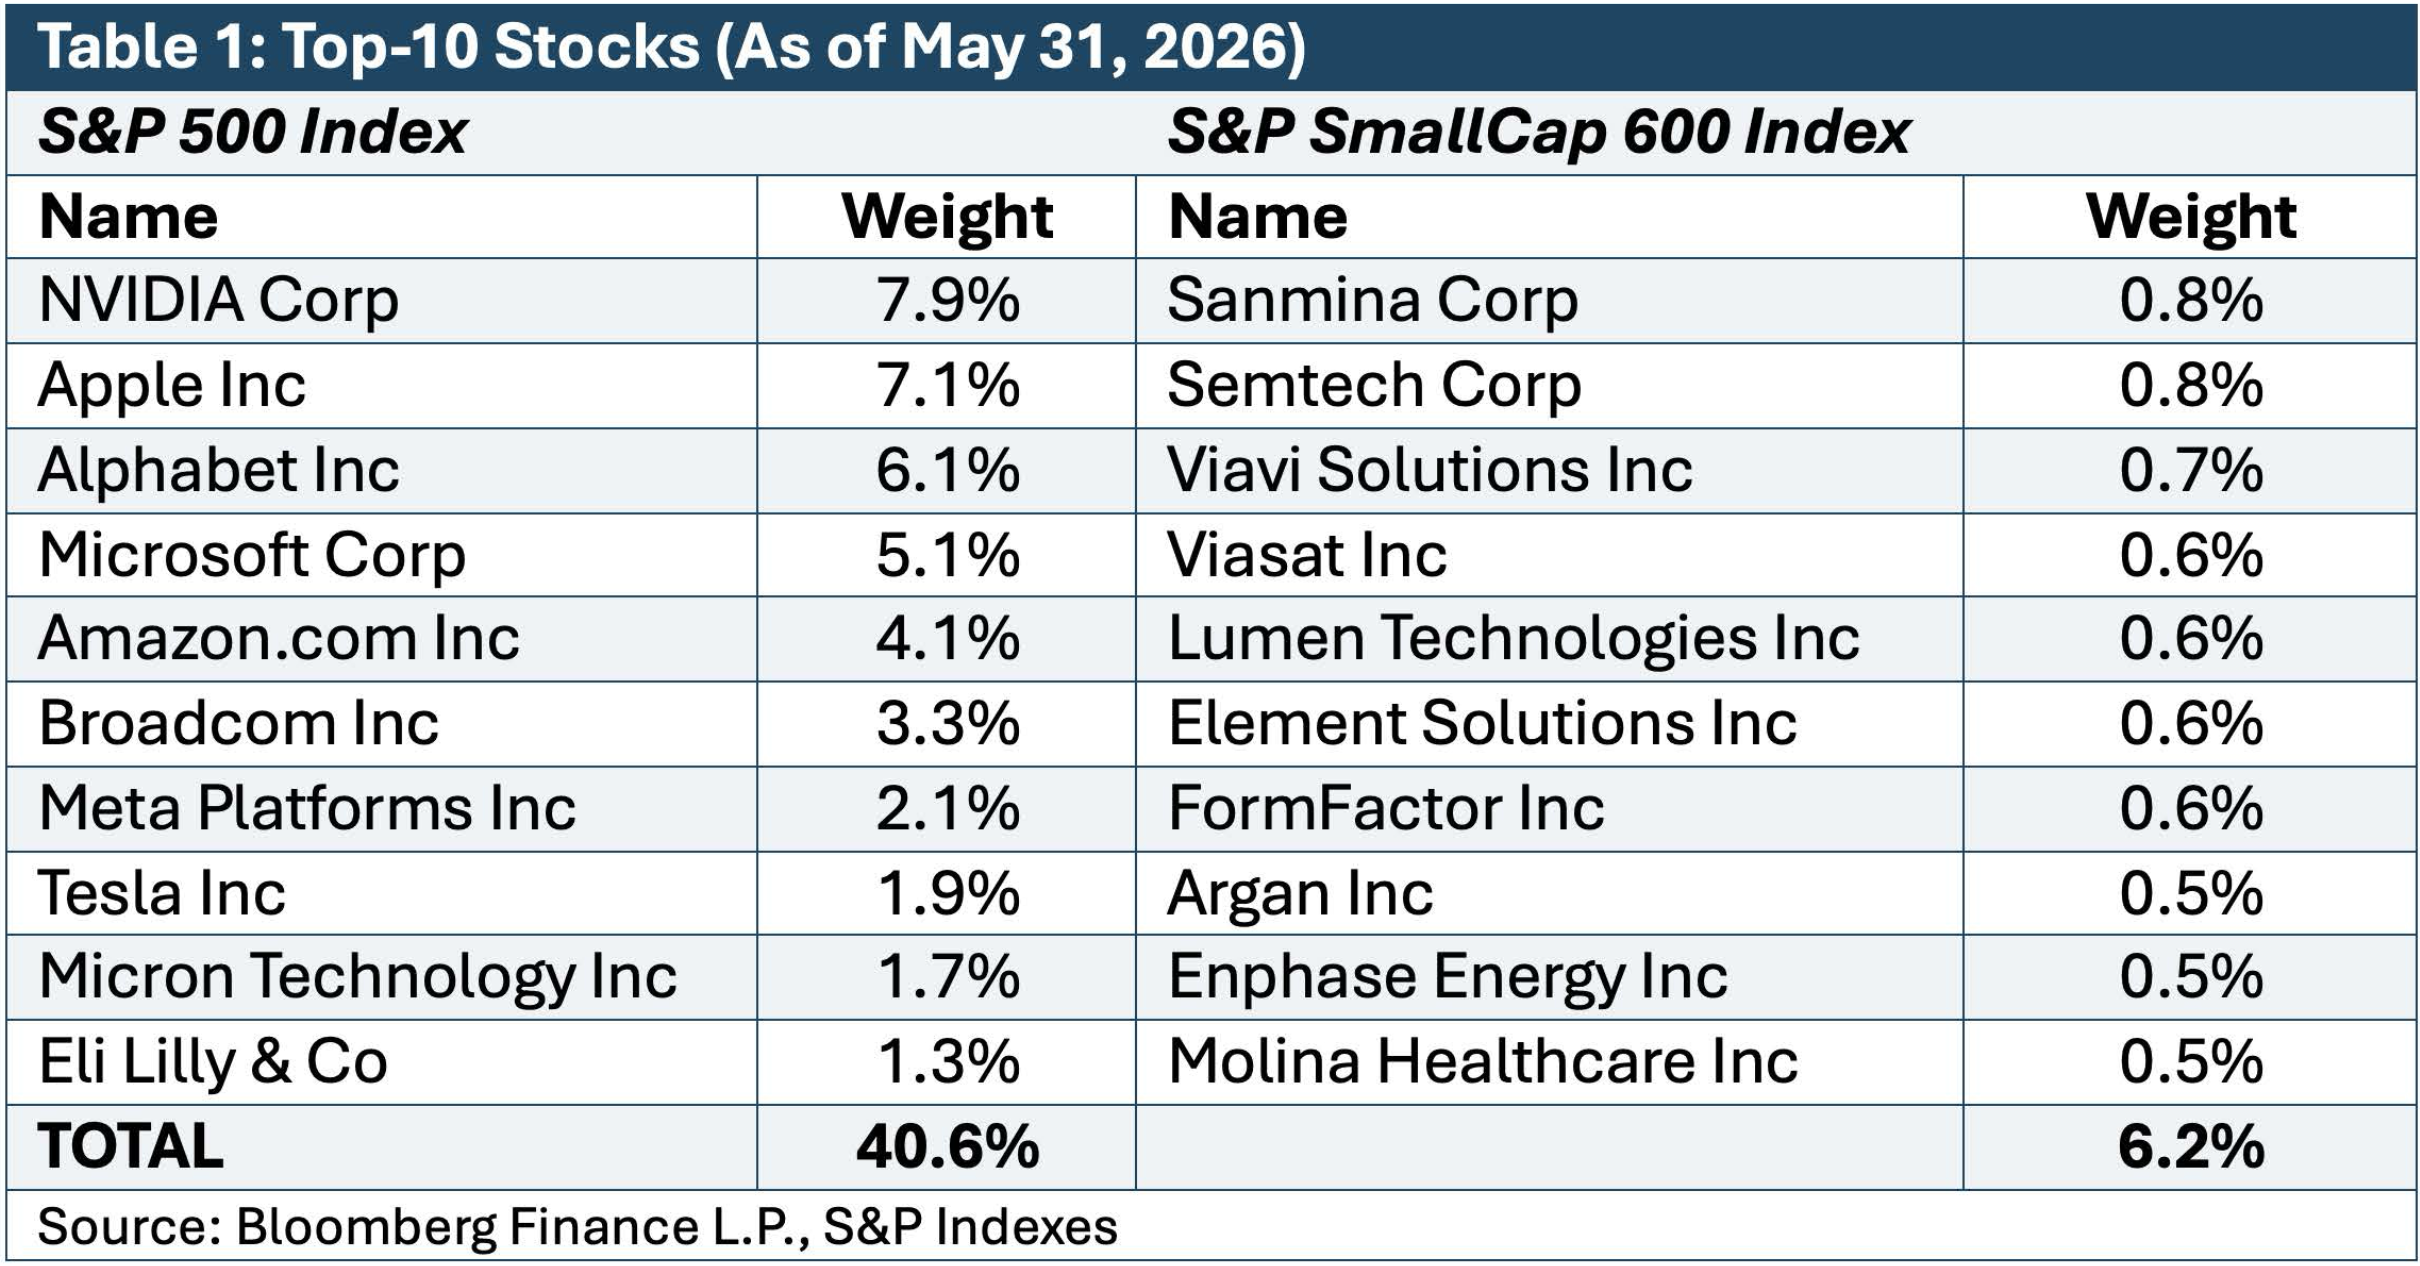
From an individual security perspective (Table 1), the top-10 securities in the S&P 500 Index were similarly concentrated compared to the S&P SmallCap 600 Index, with cumulative weights of 40.6% and 6.2%, respectively, as of May 31, 2026.
Valuation Advantage: US Small-Cap Trades at a Discount to US Large-Cap
US Small-Cap stocks tend to trade at more favourable valuations compared to US large-cap stocks in both absolute and relative terms.
A common valuation metric for stocks is the price-to-earnings multiple (“P/E multiple”), which indicates the multiple at which a company’s prevailing stock price is relative to its reported earnings. For example, a company whose stock is trading at $10 per share and has had reported earnings over the past 12-months of $1 per share has a trailing P/E multiple of 10x. A higher P/E multiple indicates a higher stock valuation, and a lower P/E multiple represents a lower stock valuation.
Valuations can be assessed both on an absolute basis (current levels) and on a relative basis (compared to historical averages).
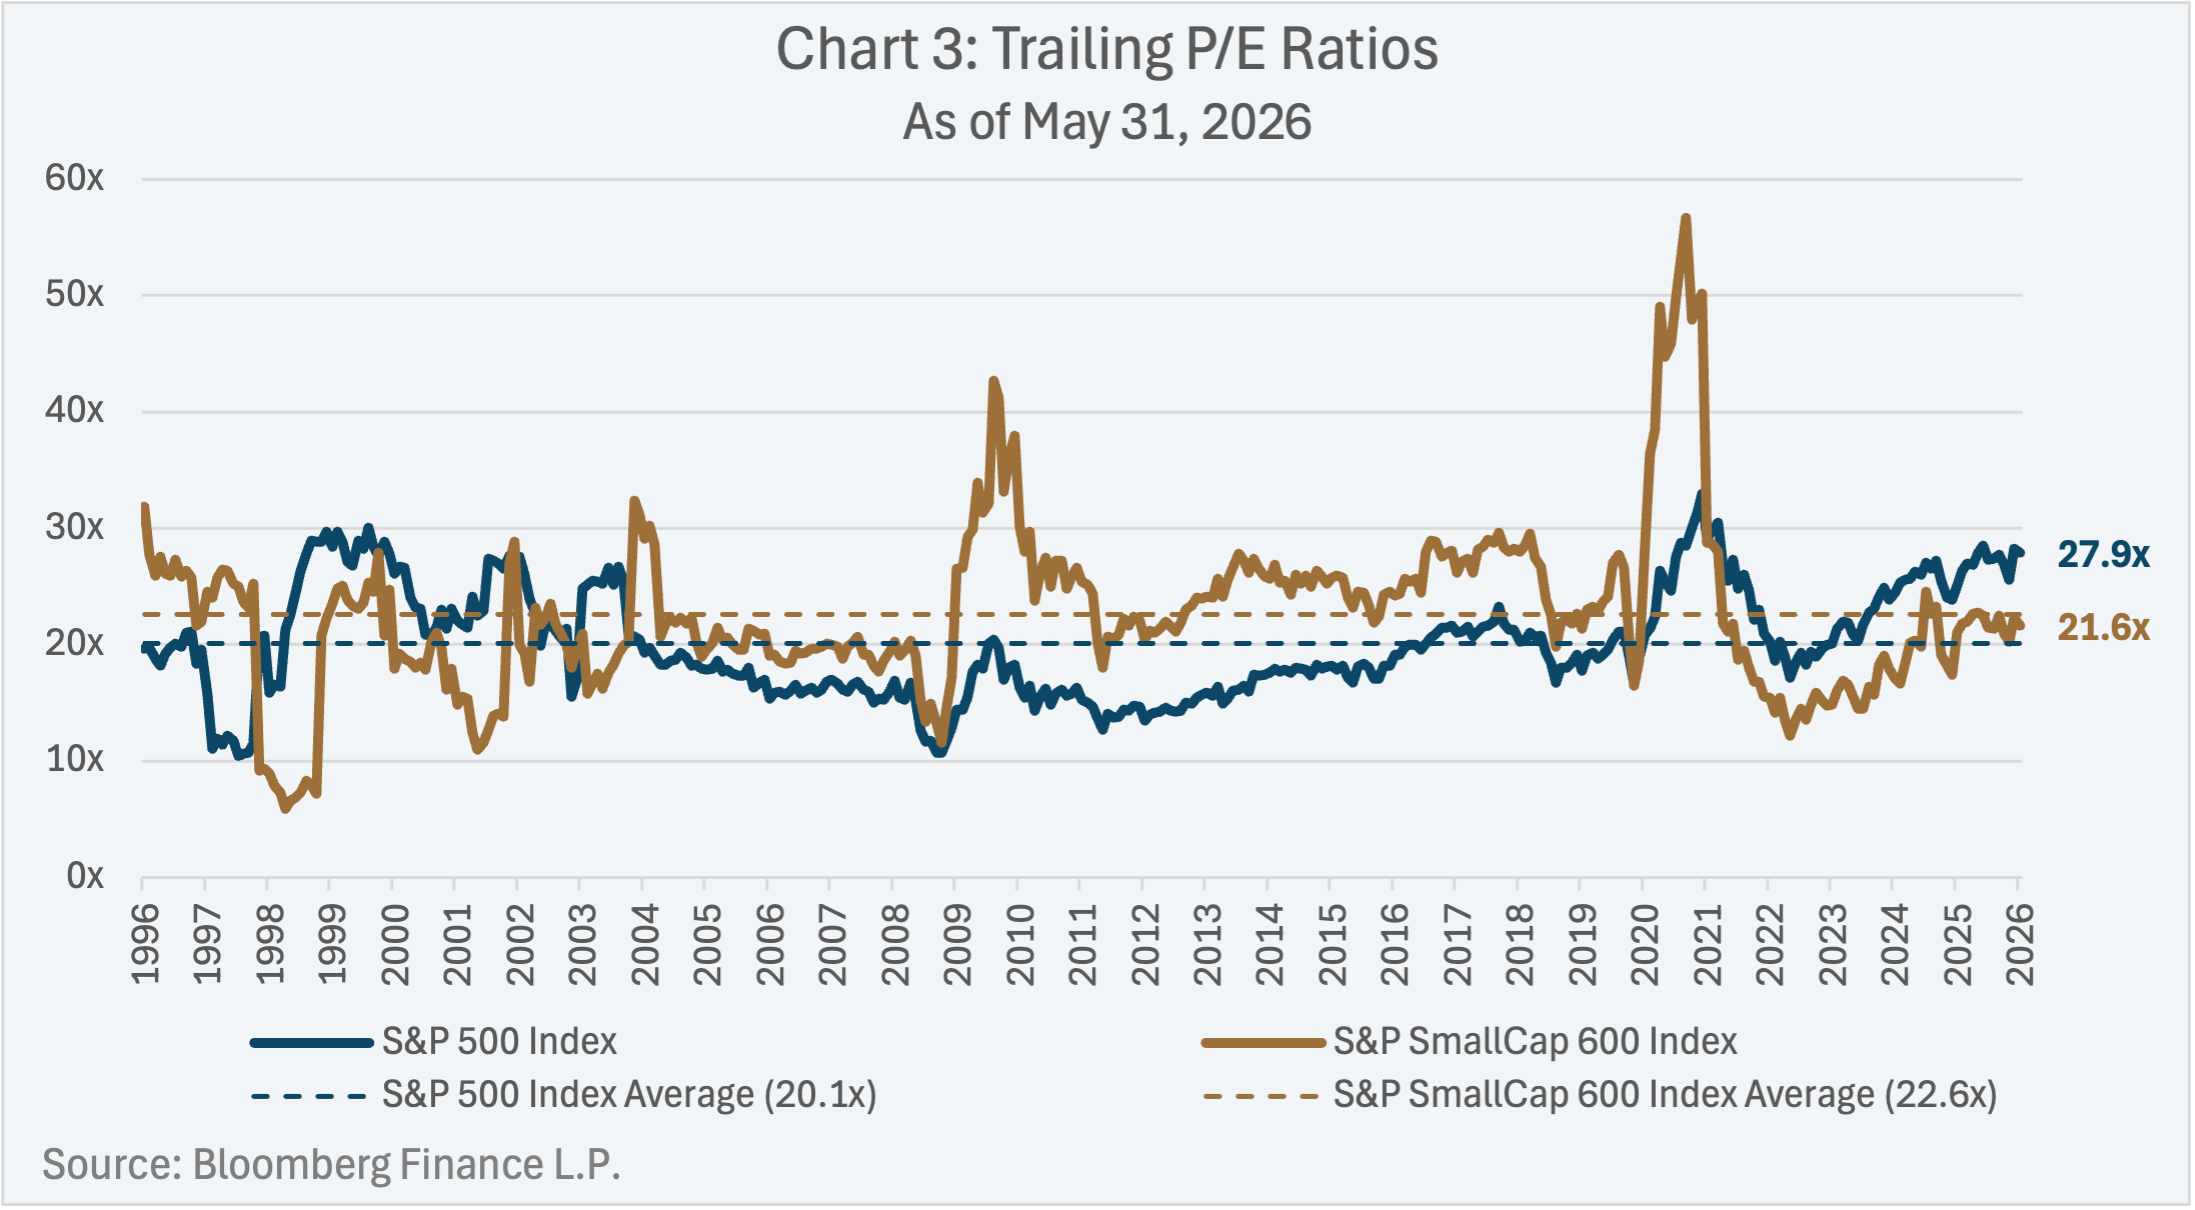
On an absolute basis, the S&P SmallCap 600 Index traded at a trailing P/E multiple of 21.6x, compared to 27.8x (Chart 3) for the S&P 500 Index, as of May 31, 2026, highlighting that small-cap equities are trading at a discount to large-cap equities.
On a relative basis, (i.e., compared to each index’s long-term average), the trailing P/E multiple of the S&P SmallCap 600 Index was 1.0x below its long-term average, suggesting modest undervaluation, while the trailing P/E multiple of the S&P 500 Index was 7.7x above its long-term average, indicating elevated valuations relative to its history.
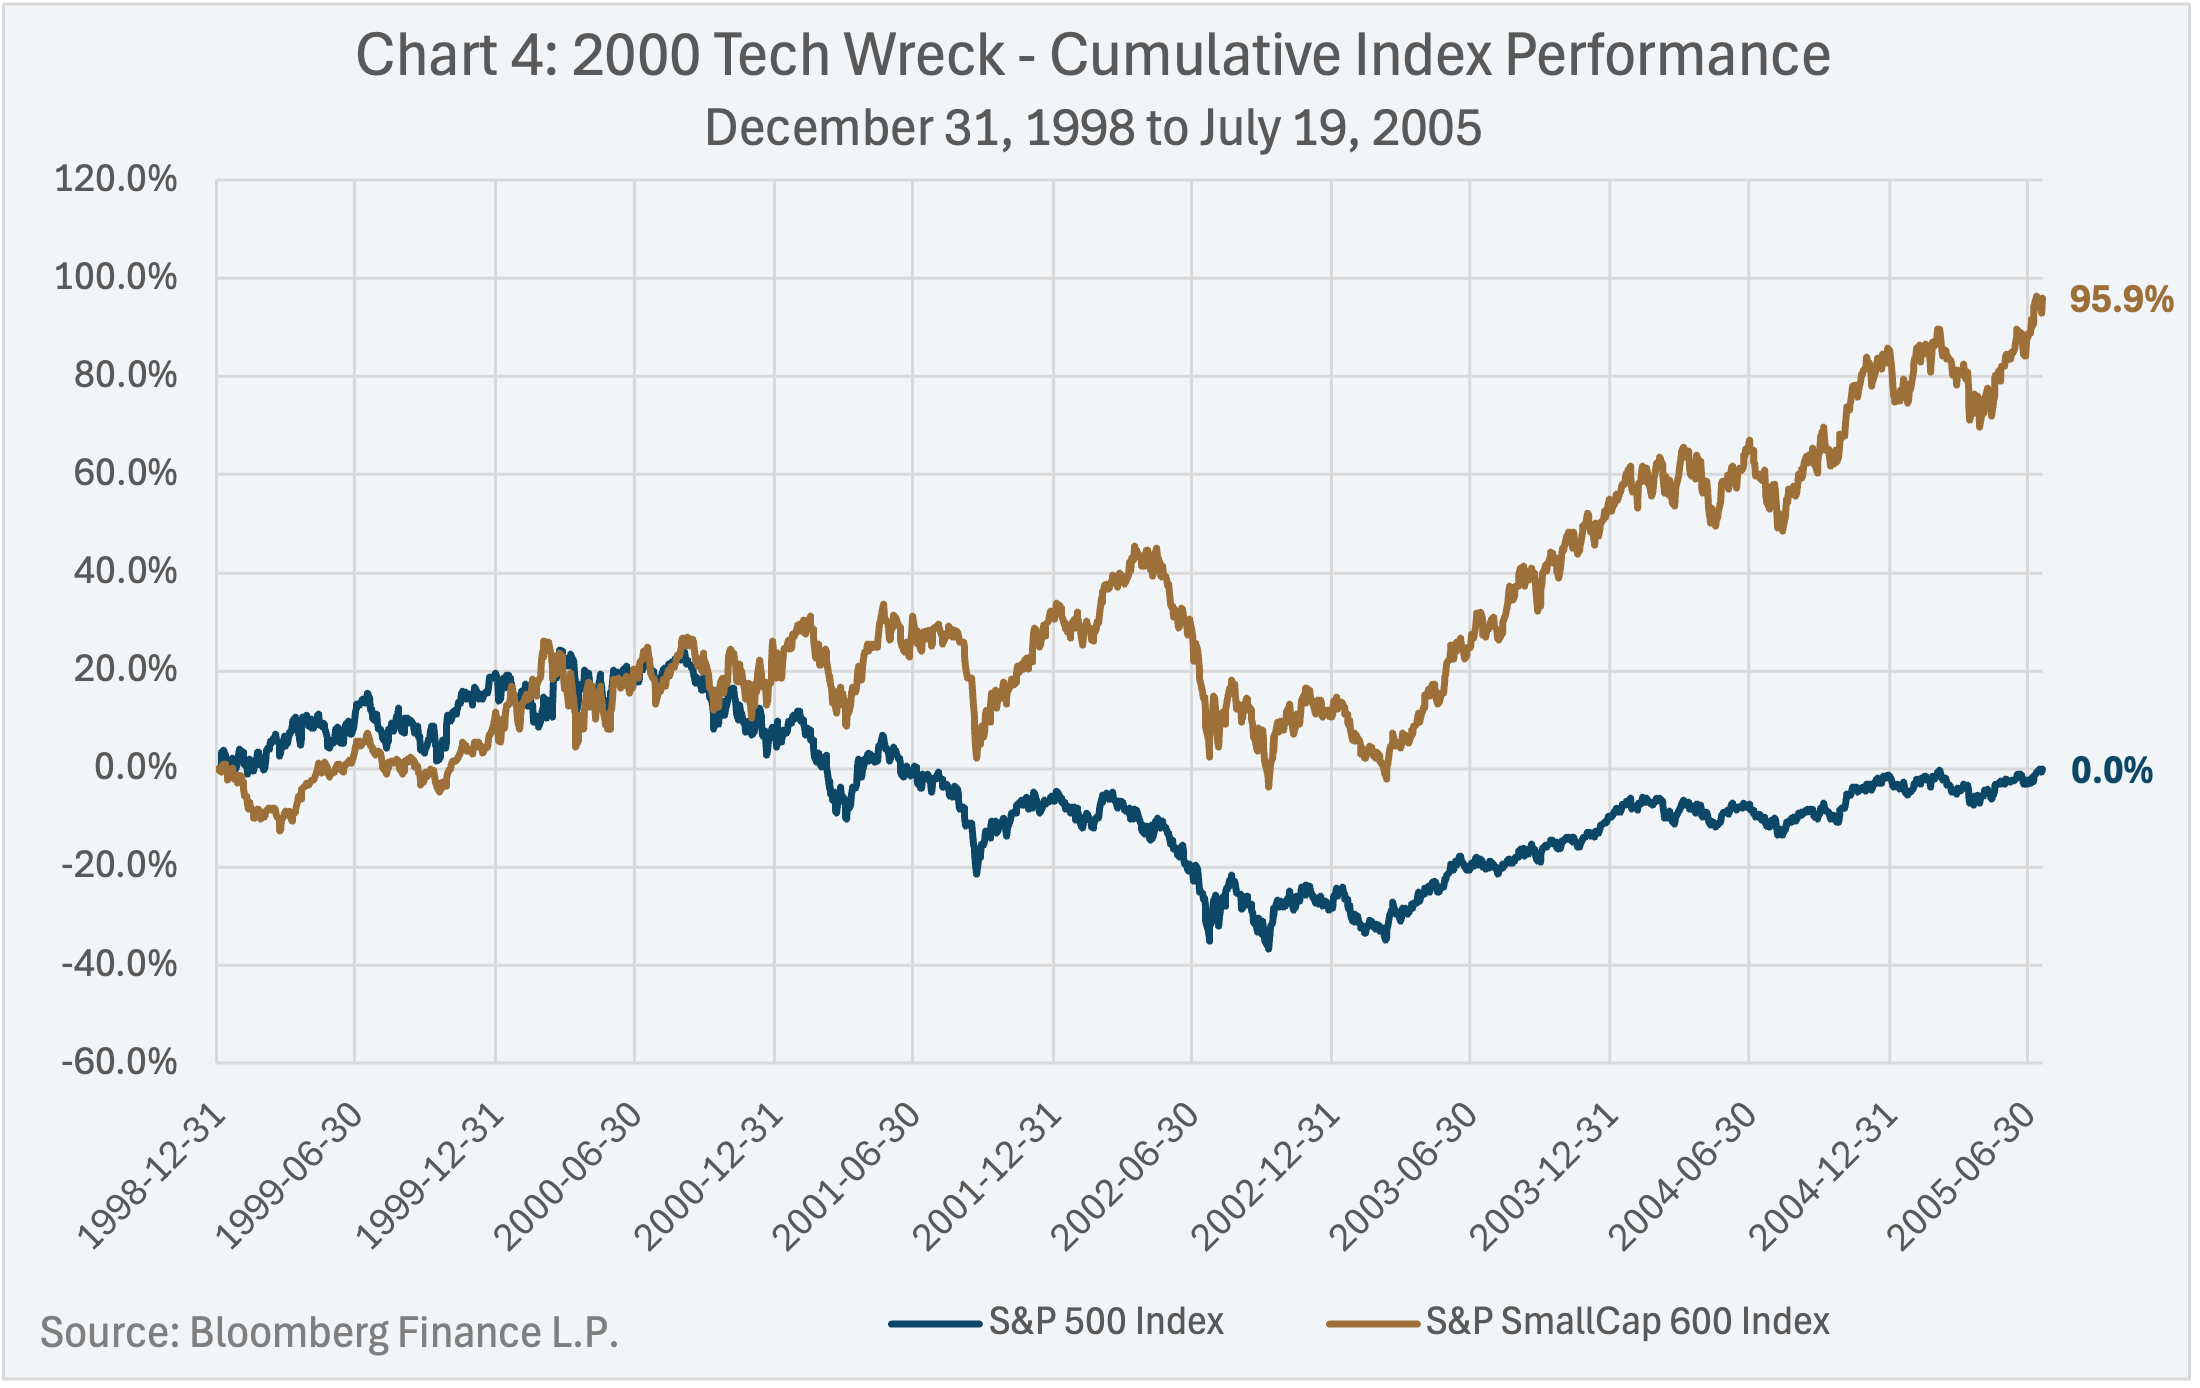
Historical Precedent: Outperformance of US Small-Cap Post-2000 Tech Wreck
As the saying goes, “history doesn’t repeat, but it can often rhyme”. A historical parellel to the current concentration of US large-cap stocks to the Information Technology sector is the 2000 Tech Wreck.
During the Tech Wreck, the S&P 500 Index peaked on September 1, 2000. At that time, the Information Technology sector weight in the S&P 500 Index was 29.2% and the trailing P/E multiple was 24.1x (compared to 38.6% and 27.8x, respectively, as of May 31, 2026).
An investment in the S&P 500 Index prior to the 2000 Tech Wreck on December 31, 1998 (Chart 4), would have resulted in an investor not earning back their initial investment following the 2000 Tech Wreck, until July 19, 2005. Over the same investment horizon (December 31, 1998 to July 19, 2005), an investment in the S&P SmallCap 600 Index would have returned 95.9%.
Conclusion
It appears that investors continue to have significant exposure to US large-cap equity in their portfolios, as reflected in the growth of assets in ETFs that track the S&P 500. Adding US small-cap equity exposure to an investment portfolio may lower concentration risk, improve valuation, and introduce differentiated drivers of return that have historically added value across market cycles.
Lysander Funds
Lysander Funds has partnered with Pembroke Management Limited to offer Canadian investors an actively-managed mutual fund that concentrates on US small-cap and mid-cap equity securities – Lysander-Pembroke U.S. Small-Mid Cap Fund.
Footnotes
- The S&P 500 Index is a market-cap weighted index of US large-cap stocks.
- The top-3 largest US Equity ETFs include: Vanguard 500 Index Fund, iShares Core S&P 500 ETF, and State Street® SPDR® S&P 500® ETF Trust.
- The S&P SmallCap 600 Index is a market-cap weighted index of US small-cap stocks.