

Don’t put all your eggs in one basket … but what if it is The basket
Market Commentary:
With change, hope springs eternal. The start of a new US presidency always brings optimism … to some. The high level of equity valuations is indicative of the hope in Artificial Intelligence (AI) and the presidential pronouncements shouted (and subsequently signed). While the level of rhetoric is high, there is no questioning the new U.S. administration’s focus on government efficiency and technology. The latter, whose seven torch bearers (NVIDIA, Apple, Microsoft, Amazon, Meta, Tesla, and Alphabet) contributed to over half of the S&P 500’s 25% total return in 2024 leave equities exposed to a change in sentiment and/or disappointing earnings from these highfliers.
Risk markets (equity and credit) rallied aggressively after Donald Trump won his second term as President in early November. On December 31, 2024, U.S. Investment Grade and High Yield corporate bond spreads were 82 and 292 basis points, respectively. Since the beginning of the year these corporate bond indices have tightened to 80 and 261 basis points respectively (as of January 23, 2025).
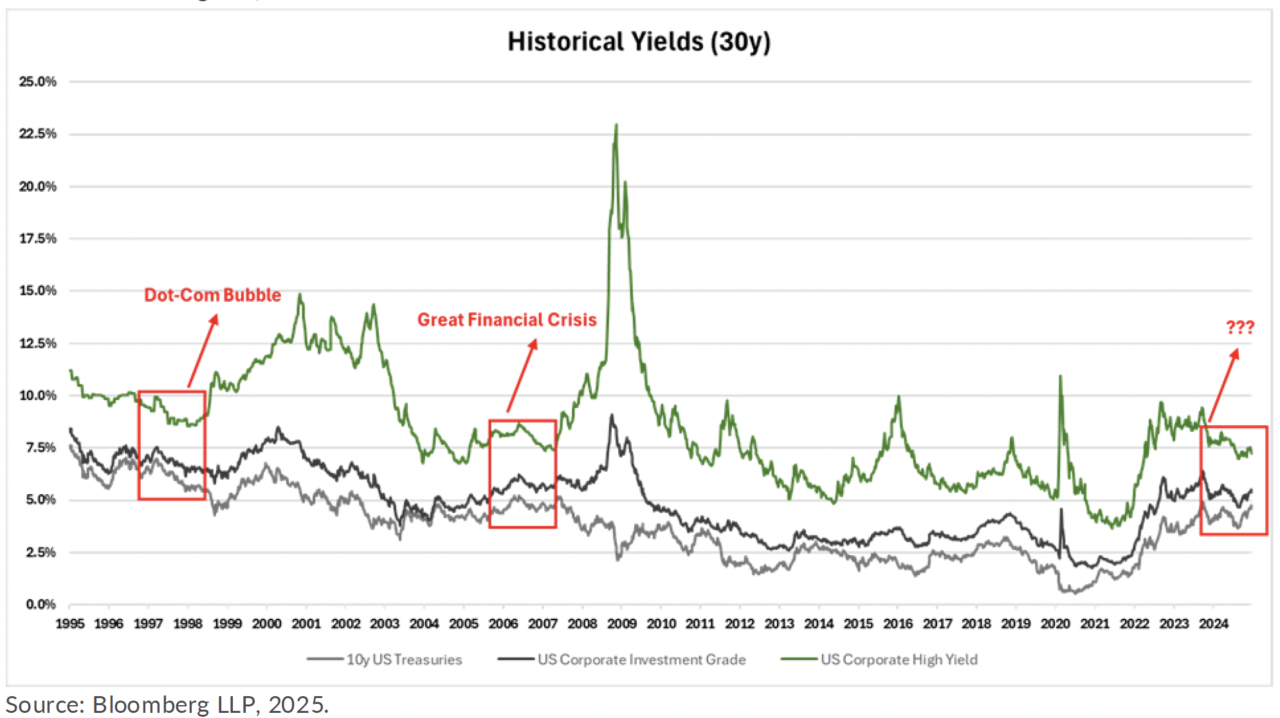
The last time credit spreads were this tight was prior to the “DotCom Bubble” and “Great Financial Crisis”. Back then, valuations held high for so long that even the most seasoned bears were swayed into thinking that “this time is different.”
Dot-Com Bubble
High yield corporate bond spreads hit their low of 244 bps in October 1997 over two years before the Dot-Com Bubble began to burst. While High Yield spreads were “teased” 400 bps higher as result of the “Russian Ruble Crisis”, this mini event couldn’t slow down the larger narrative that the internet was going to change the world and within six months spreads tightened in half.
As the clock turned to a new century, the impact this zenith technology was having on valuations started to come back down to earth. In 2000, High Yield spreads doubled, and Investment Grade spreads almost doubled to 916 bps and 202 bps, respectively, by year end.
Nonetheless, it wasn’t until later that year in August 2000 that the S&P 500 started to turn negative. Yet two years later, by September 2002, it was down 45 percent. While credit markets saw most of their spread happen prior to the turn in equity markets, High Yield and Investment Grade spreads hit a cycle high of 1,120 bps and 272 bps, respectively, in October 2002. This not coincidentally marked the cyclical bottom for the S&P 500.
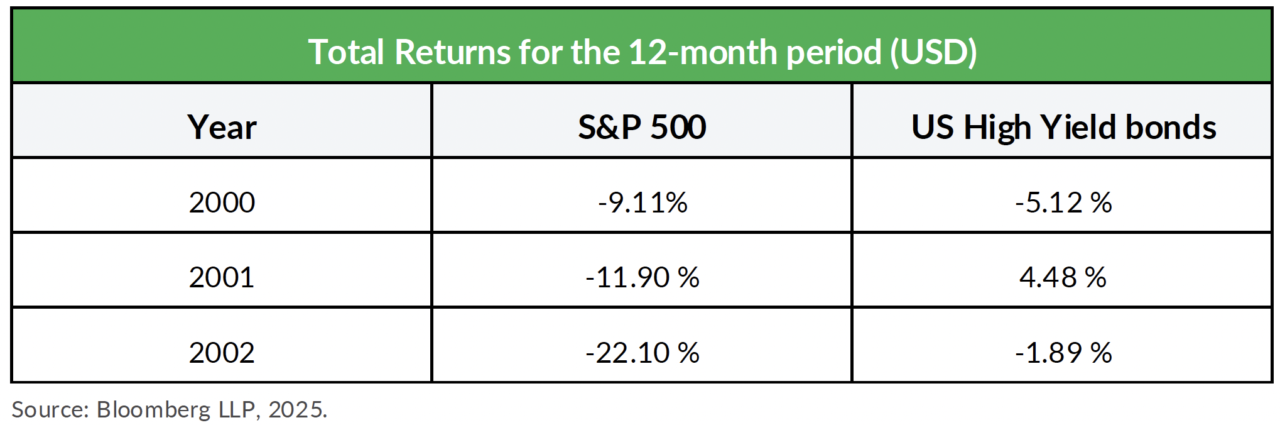
The total return for High Yield bonds and the S&P 500 over the three-year period from 2000 to 2002 was -2.8% percent and -37.6%, respectively. While the price return of High Yield bonds over this period was -26.2%, the 23.5% income generated over these three years substantially offset the negative price returns.
Great Financial Crisis
In June 2007, 15 months before the Great Financial Crisis crash, High Yield spreads bottomed at 241 bps. They then proceeded to move higher with much volatility in 2008 before spiking dramatically from 800 bps in September 2008 to over 2,000 bps by the end of the year and remaining over 1,500 bps until May 2009.
While the U.S. economy was in a recession from 2007 to 2009, the seeds of despair that resulted in the collapse of firms like Lehman Brothers (3rd quarter of 2008) were aided by the low-interest rate environment that was administered to help the economy’s recovery from the Dot-Com Bubble.
If you think we are laying some breadcrumbs … you assumed correct. Of course, we are not suggesting that the current lofty valuations of “risk” markets are going to lead to a crash, we do think investors need to tread carefully.
So, what is driving market participants to price credit risk so aggressively?
Is it that A.I. will reduce business costs causing higher EBITDA and lower leverage? Is it that demand for fixed income by aging investors is outstripping supply to such an extent that the market price-setting mechanism has become unbalanced? Is it that Private Credit investors have underwritten all the risky debt leaving traditional fixed income investors to fight over what is left?
Adding further to our concern about credit valuations is that indications are equities are also very expensive today. The S&P 500 currently trades at over 25 times its earnings, a level last seen over 20 years ago, if you exclude the two years during the pandemic, when earnings for most companies dropped dramatically.
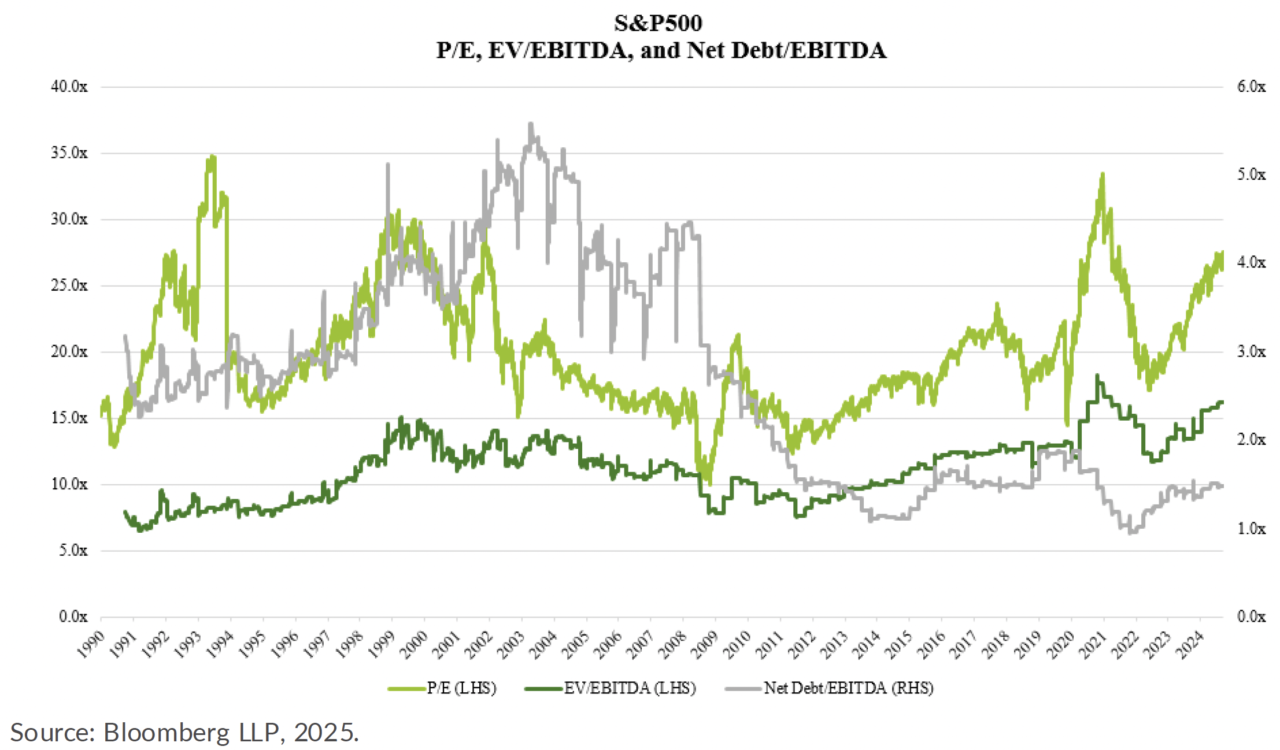
Furthermore, the Enterprise Value (value of equity market capitalization plus debt) over cash flow (i.e. EBITDA) ratio suggests that, excluding the two years during the pandemic, equity prices today have never been more expensive. Yes, even more expensive than during the Dot-Com Bubble of the late 90s. While this elevated EV multiple may give investors pause, it is worth considering that, alongside any genuine impact from A.I., the current debt levels of public companies in the S&P 500—measured by the net debt-to-cash flow ratio—are significantly lower today than they were leading up to either the Dot-Com Bubble or the Great Financial Crisis. While this is good for credit investors, as there is more equity cushion below us in the capital structure, it won’t help equity investors if a negative catalyst (e.g. higher interest rates or economic recession) rears its head.
What about the Future …?
Glad you asked, but don’t expect a simple answer. On the positive side, interest rates have risen over the past few years, which means bonds—regardless of credit type—are poised to perform well and offer more attractive yields. Yes, higher rates will make it tougher for some companies to refinance their debt, but we believe many will use this environment to conservatively restructure their balance sheets—whether they’re investment-grade issuers refinancing at par or high-yield companies pursuing sub-par exchanges. In either case, today’s higher total return potential gives bond investors increased leverage to negotiate more favorable terms with the right issuers.
With U.S. 2-year Treasury yields comparable to where they were a year ago at 4.3%, credit spreads approaching all-time lows, and equity markets inexplicably rising higher, playing defense in credit doesn’t mean giving up income and returns.
Overall, we remain optimistic about the opportunities within higher-quality, event-driven, short-duration, corporate bonds. There is also a growing expectation among market participants that mergers and acquisition activity could increase under the Trump administration. In the meantime, we are focused on these opportunities while monitoring more specific idiosyncratic situations and the potential for broader market weakness, which may not be far off.
- As represented by ICE BofA US High Yield Index USD (HOAO)