

Lather, Rinse, Repeat
We started 2021 talking the pandemic and central banks. We ended the year talking the pandemic and central banks. In January, U.S. headline inflation hit 7.5% for the first time in nearly 40 years. Higher for longer inflation moved Federal Reserve Chairman Jerome Powell from the sidelines to the headlines. An upward adjustment to the Fed funds rate is now a certainty at the March 16th Fed meeting, kicking off what is expected to be a series of hikes in 2022 and 2023. Further, the Fed telegraphed the unwind of its balance sheet will begin not long after its initial rate hike. The Bank of Canada is on the same path as the Fed. Overseas, an impatient Bank of England has already raised rates twice, and in a significant policy shift, even the ECB has not ruled out rate increases for 2022.
Tryin’ To Live My Life Without You
With the Fed and the Bank of Canada poised to raise administered rates, individuals, businesses and markets are left to consider what happens to longer term yields. Recall, the world’s central banks responded to the Covid-19 crisis with a series of emergency rate cuts. For the Federal Reserve and Bank of Canada, these cuts dropped overnight rates to 0.25%, a rock bottom level seen only in the aftermath of the Credit Crisis. Now the journey to higher rates begins.
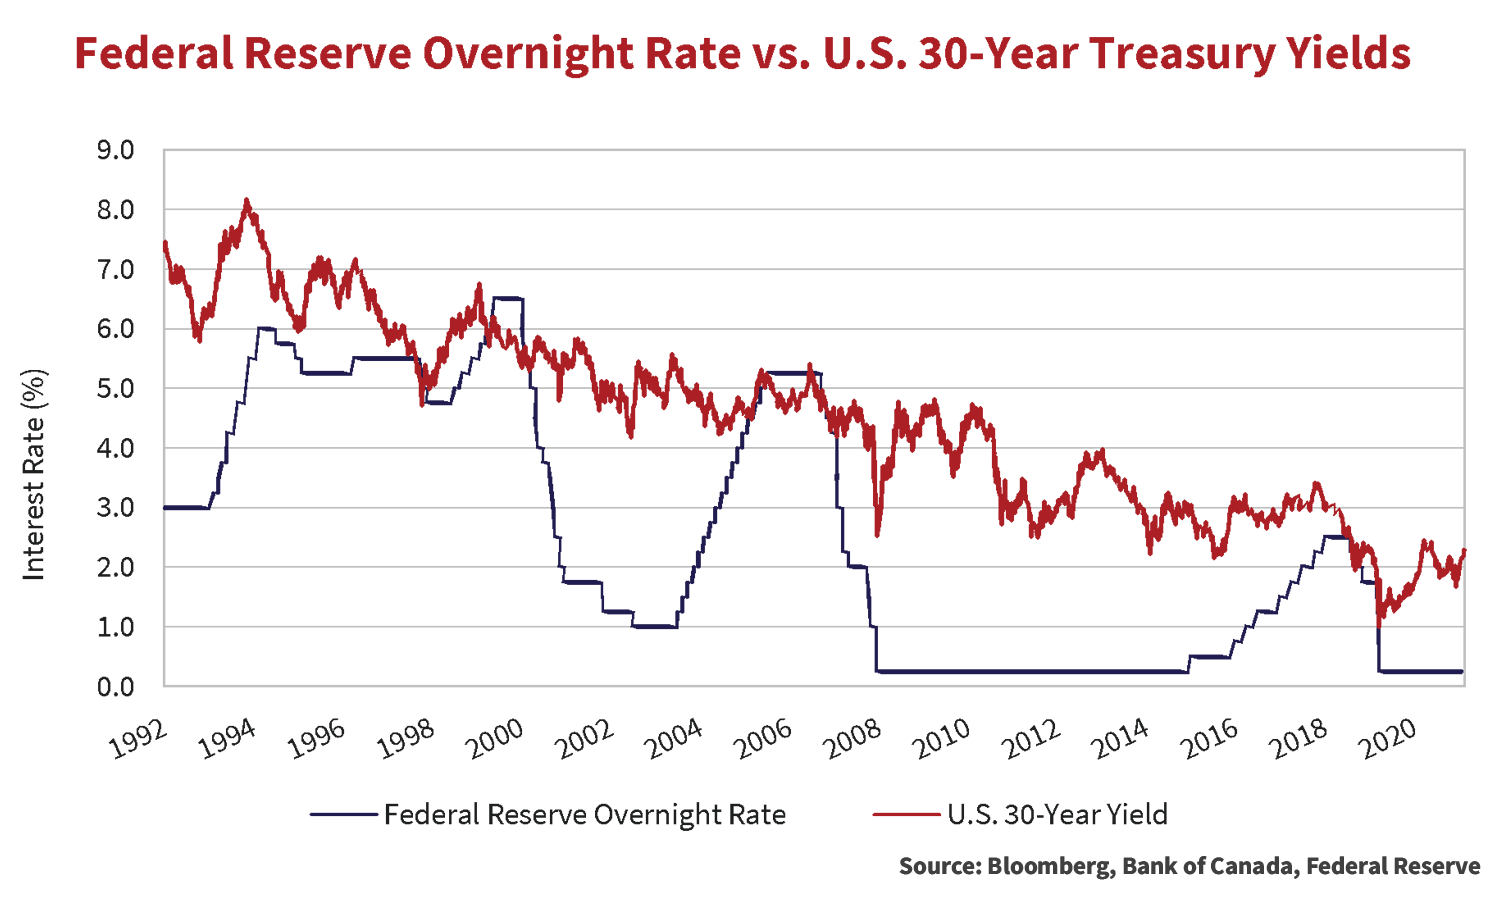
The chart above plots the Federal Reserve funds rate versus 30-year U.S. Treasury yields covering four tightening cycles dating back to 1992. At the end of the 1995 and 2000 cycles, 30-year U.S. Treasuries closed 1.38% and 0.15% higher than yields the day the tightening cycle began (the “going-in yield”). In the last two cycles, ending in 2006 and 2018, long yields finished 0.04% and 0.02% lower than the going-in yield. Over the span of the 2006 and 2018 tightening cycles, 30-year yields averaged 0.54% and 0.14% lower than the going-in yield.

The chart above plots the Bank of Canada overnight rate versus 30-year government bond yields covering eight tightening cycles dating back to 1992. In all but the first and last cycle, on the date of the final tightening, Government of Canada 30-year bonds closed at lower yields than the going-in yield. During those six cycles in between, 30-year yields also averaged lower than the going- in yield. In the last cycle, ending in 2018, long yields finished 0.24% higher than the going-in yield and averaged 0.11% higher over the cycle.
History shows once tightening cycles begin, the largest yield moves occur in the shorter end of the curve with the most modest moves in the long end.
Message In a Bottle
There are plenty of reasons longer yields should be substantially higher than they are now. First, at 7.5%, U.S. inflation remains well above the Fed’s 2% long-term target and will likely remain elevated for some time. Second, if inflation returns to the 2% target with long yields just above 2% currently, real yields will approximate zero providing no return for investors, not an attractive investment proposition. Third, deficit spending and the end of central bank quantitative easing requires the market to fund the entirety of still substantial government deficits. This funding pressure could put upward pressure on yields. Finally, investors, particularly retail investors, are rightly cautious over owning longer duration assets. The U.S.$9.5 billion influx into floating rate, leveraged loan funds in January 2022 is evidence of this caution.
Offsetting the catalysts for higher yields are several factors. First, central banks’ mandate requires them to attempt to bring inflation back to the 2% target and they may over-compensate by raising rates too quickly and too high in their attempts to do so. Second, long bond yields have been low for an extended period. 30-year bond yields in the U.S. and Canada averaged 2.72% and 2.16% respectively over the last 10 years. The market is more used to lower bond yields than it gives itself credit for. Third, in anticipation of central bank rate hikes, bond yields have already moved higher. Since the end of 2020, yields are 67bps and 99bps higher in the U.S. and Canada respectively. Finally, the demand for long duration fixed income assets from pension plans and insurance companies may compensate, or at least temper, the absence of central bank and retail investor buying of duration products.
Given the risk of owning longer duration assets in a rising rate environment, it takes a strong stomach to bet the market has “priced” in central bank tightening. We will continue to buy long duration corporates when we feel the potential for spread compression can offset potentially higher benchmark yields.
Go Big Or Go Home
Elsewhere in the world, Apple recently recorded two milestones. First, Moody’s upgraded the company’s senior debt to Aaa, a corporate rarity. Then early in 2022, Apple’s market capitalization surpassed $3 trillion, the first company ever to reach that valuation.
On the other end of the valuation spectrum, real estate behemoth Evergrande continued to stumble through what is likely to be a protracted debt restructuring. Offshore creditors, including distressed debt specialist Oaktree Capital, are attempting to wrestle value from the remnants of one of China’s largest property developers, Chinese domestic creditors and possibly the Chinese government itself. The markets will learn firsthand the state of China’s capital markets and if its legal system protects lender rights, including those of foreign creditors.
Long-Term Beats Short-Term (Temporarily)
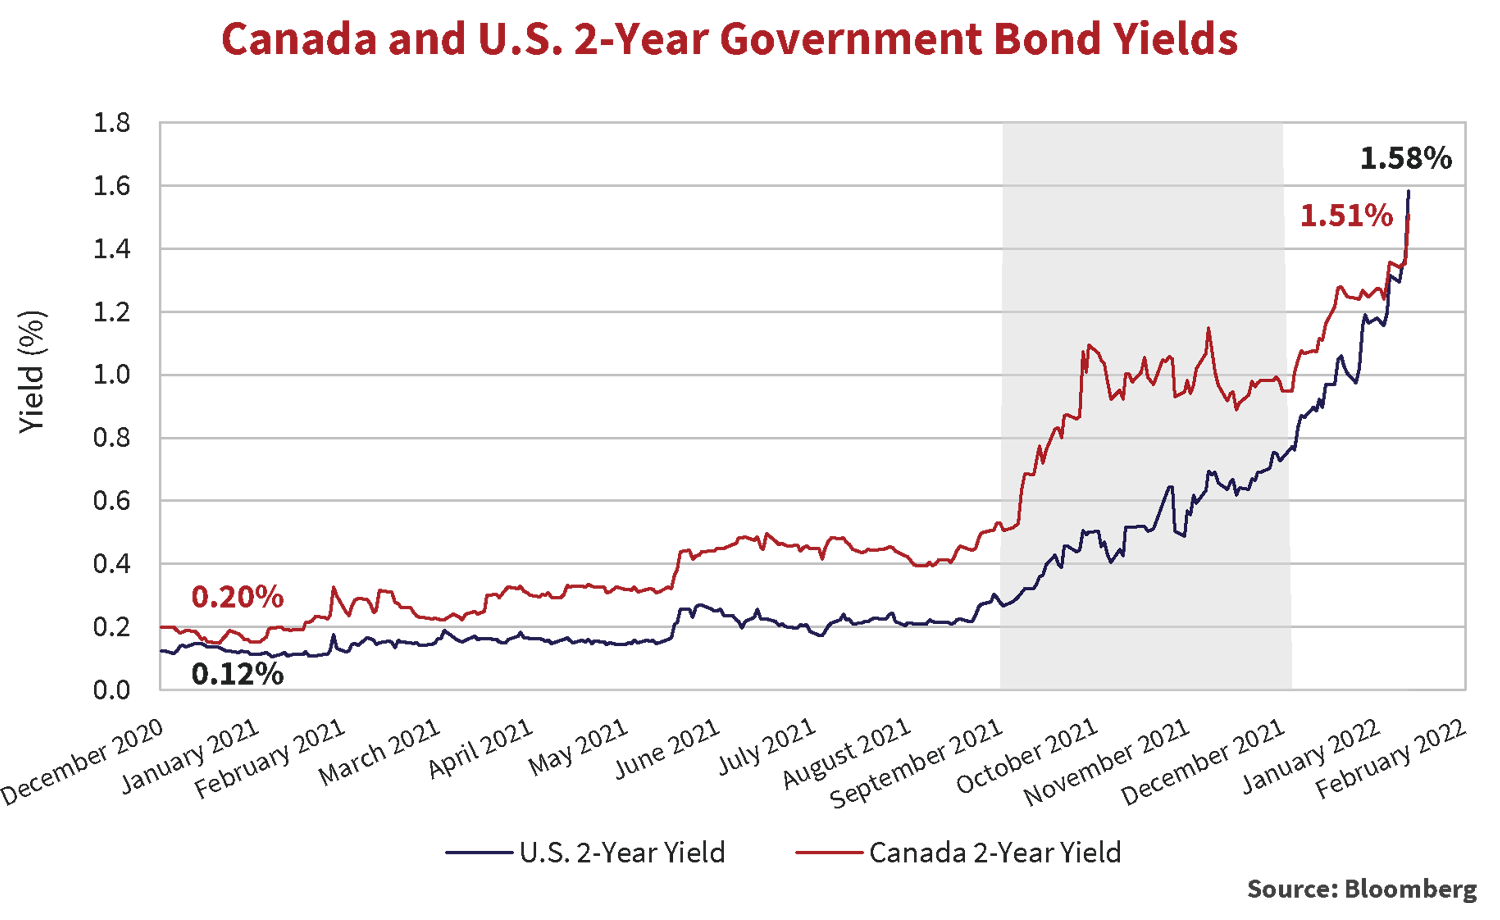
For the quarter ended December 31st, higher quality bonds in Canada outpaced lower quality. The government bond heavy, longer duration, Broad Index returned 1.7%, versus the Investment Grade Corporate Index return of 1.3%. Strong absolute and relative performance occurred despite higher short term government bond yields on the back of hawkish sentiment from central banks. The graph below illustrates the movement of the 2-year government bond yield in both Canada and the U.S. over the course of 2021. The shaded area highlights a spike of over 40 basis points in both Canada and the U.S. during the final quarter of the year. The trend higher has continued in 2022 with short term yields continuing to climb moving 56bps higher in Canada and 85bps in the U.S.
Returns driven by the move lower in the long end of the yield curve overwhelmed the impact of higher short-term yields. The graph below plots Canadian and U.S. 30-year government bond yields. The emergence of the Omicron variant at the end of November drove a rally in long-term government bonds as markets temporarily ignored high inflation and looming tighter monetary policy. Yields fell 31 basis points in Canada in the quarter, driving a 4.2% return for long corporate bonds. The reprieve did not last long, as the long end of the yield curve has continued its path higher thus far in 2022, quickly erasing the fall into the end of 2021.

Train In Vain
Per the graph below, the -1.3% return for the ICE BofA Canada Investment Grade Corporate Index in 2021 marks the worst for a calendar year since the inception of the index. On November 23rd, the year-to-date return of the Index stood at -3.7%. If not for the rally in long government bond yields to end the year, the result would have been a lot worse.

In January 2022, the Canadian corporate index gave back fourth quarter gains and then some. The surge in government bond yields, combined with modestly wider credit spreads, translated to a -2.4% return. Only March 2020’s -6.2% and September 2008’s -3.0% returns, both driven by significant sells-offs in credit, outpaced January’s drawdown. Year to date, as of publishing, the Canadian corporate index is now down -3.7%. We expect the key driver of investment grade corporate returns to continue to come from movements in underlying government bond yields.
Steady As She Goes
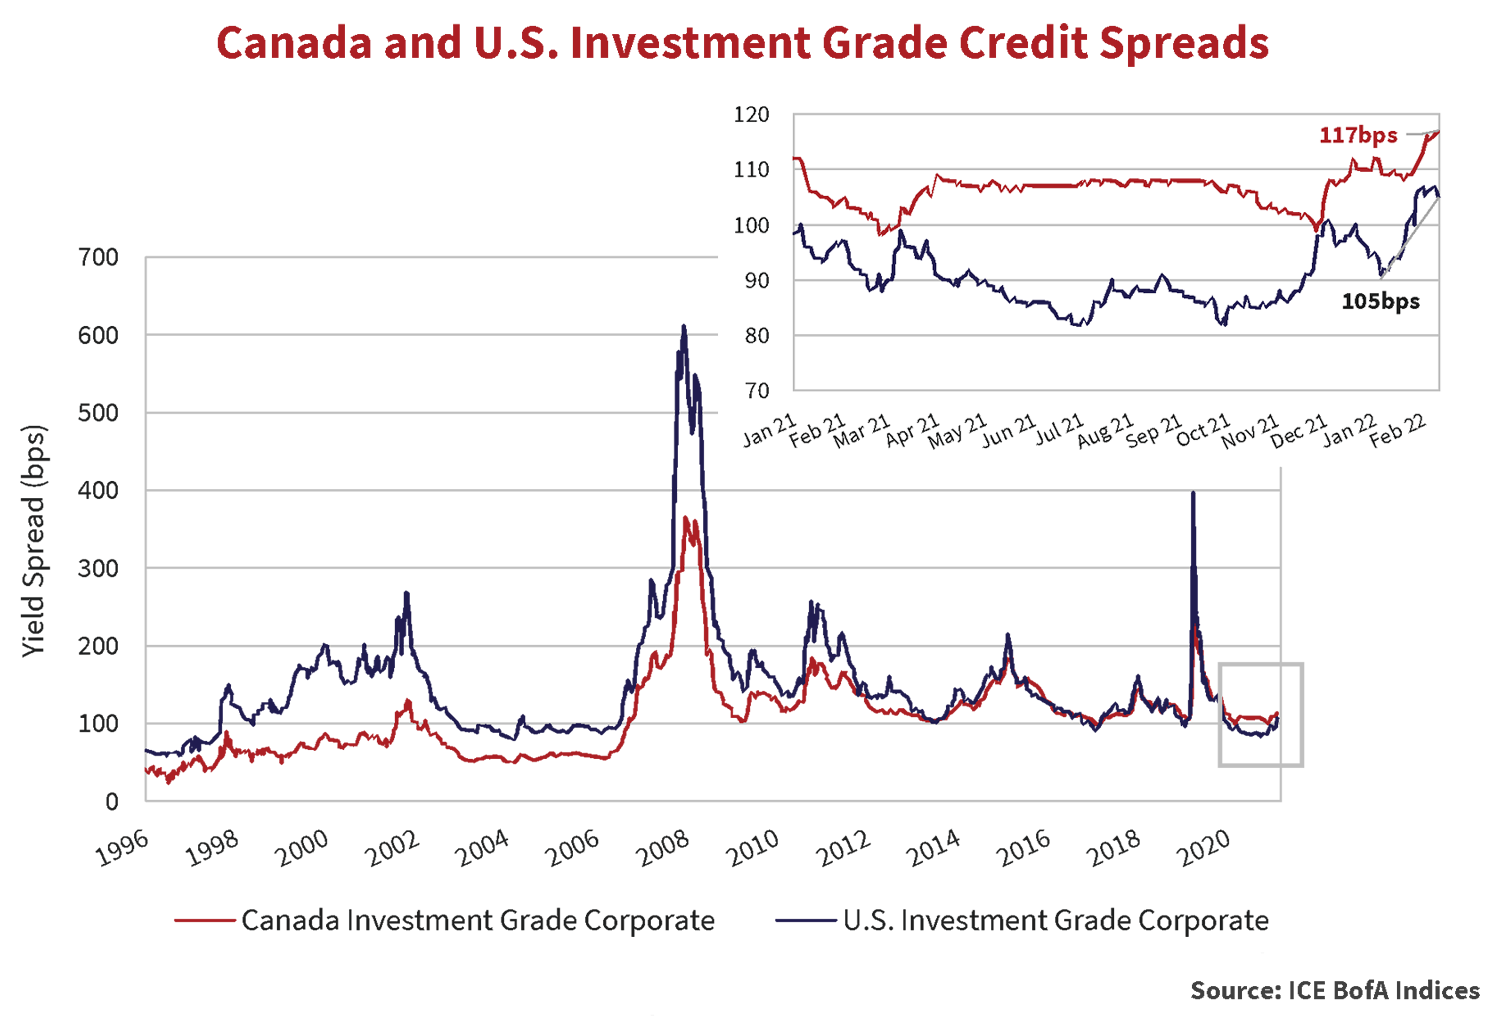
For much of the year, spreads in investment grade were steady, impervious to headlines driving volatility across equity markets. The fall in government bond yields precipitated by Omicron contributed to investment grade spreads moving slightly wider. Focusing on more recent experience, the graph below illustrates widening credit spreads in both the Canadian and U.S. investment grade markets. Despite this move, spreads are only modestly wider than where they began 2021.
Holiday Cheer
Volatility returned to the U.S. high yield market in the fourth quarter. As the graph below shows, spreads gapped wider in the latter part of November, driven by the spread of Omicron and exacerbated by thin trading around the U.S. Thanksgiving Holiday. In early December, high yield spreads rallied with other risk markets to finish the quarter unchanged. In January, market uncertainty drove spreads 60 basis point higher.

Paradise by the Dashboard Light
The 5.4% return of the ICE BofA U.S. High Yield Index was top of class in the credit markets in 2021. Investors reaching for yield in the most speculative credits reaped the greatest reward. CCC’s returned 10.4%, compared to 4.9% for single-B and 4.5% for BB rated segments. The euphoria didn’t last long as the High Yield Index returned -2.75% in January 2022.
Extreme Couponing
Current high yield valuations offer limited upside relative to the credit risk assumed. At February 10th, the spread of the ICE BofA U.S. High Yield Index measured 366 basis points as shown by the dashed line in the graph below. Despite the pullback in spreads in early 2022, the historical perspective suggests little room for further tightening exists. Although spreads can stay tight for extended periods, chasing higher yields in expensive markets eventually invites disaster.

Foolin’ Yourself
Low default rates often lead to reckless risk taking by investors. The graph below overlays the ICE BofA High Yield Index spreads with default rates on speculative grade credit as reported by Standard & Poor’s. Substantial spread widening and years of elevated defaults often follow periods of market euphoria. The lesson, investors can stay out of trouble by avoiding high yield during periods of low defaults. 2021’s 1.36% default rate is the second lowest on record, and while periods of tight spreads and low defaults may endure for some time, we believe there is better risk-adjusted value to be found in higher quality credit.

Act Naturally
Add AMC Entertainment Holdings, Inc. to the long list of pandemic-stricken issuers to refinance higher coupon debt issued in the earliest days of the pandemic. On February 2nd, AMC priced $950 million 7.50% first lien senior secured notes due 2029. The company intends to use proceeds from the offering to redeem $500 million of 10.50% coupon notes due 2025, $300 million 10.5% coupon notes due 2026 and $73.5 million 15%/17% Cash/PIK Toggle Notes due 2026. The offering is expected to close February 14th, Valentine’s Day. Including the AMC deal, a substantial amount of debt issued in the early days of the pandemic with higher than current market coupons has been refinanced at much lower absolute yields.
My Momma Don’t Like You
If you still want to buy high yield or leveraged loans, make sure you consider the bond’s call features. Call features grant an issuer the right to retire a debt obligation at a preset price, normally after a period of call protection. These features act as a structural limit to price appreciation, leaving investors an asymmetric risk profile. If risk premiums widen significantly, or government bond yields surge, issuers lose the refinancing incentive. As a general rule, Canso prefers fallen angels over new issue high yield and leveraged loans in part due to the inclusion of make-whole calls common in investment grade indentures which are considerably more investor friendly.
Greased Lightning
J.P. Morgan reported U.S.$9.5 billion of inflows into leveraged loan funds year to date. Investors concerned about rising interest rates are looking to these funds as a hedge with the added benefit of higher relative yields and first lien priority if something goes wrong. So far in 2022, investors have been rewarded with positive returns versus the negative returns of the broader fixed income markets including high yield. We caution investors to consider the credit and liquidity risks inherent in leveraged loans and leveraged loan backed products.
First, leveraged loan issuers represent the most speculative elements in the credit markets and carry non-investment grade ratings. Second, contractual protections meant to protect lenders have been watered down or eliminated in recent years. As defaults rise, recoveries to creditors are likely to be well below historic averages, negatively impacting the returns to leveraged loan holders. According to J.P. Morgan, recoveries on 1st lien loans over the last twelve months measured $51.82, well below the $64.81 23-year average recovery. Third, loans are typically callable at par after very short periods of call protection limiting capital appreciation potential. Finally, trades meant to settle in 7 business days routinely stay outstanding for months. This creates a liquidity mismatch for funds offering investors daily liquidity. This mismatch can be acute in periods of market distress.
Based on the momentum in the leveraged loan markets, we expect we will comment on this segment of the credit markets in future newsletters.
Night Moves
Accommodative monetary policies, aggressive fiscal strategies and pent-up consumer demand all support improving corporate cash flows. Higher administered rates and reduced fiscal stimulus in 2022 will only slow, not reverse, improving credit quality in the aggregate. We expect credit rating upgrades to exceed downgrades. We expect defaults to stay low. We expect many investors flush with cash to continue their reach for yield.
Credit spreads can stay below long-term averages for extended periods. Interest rates move higher in fits and starts. Against a backdrop of substantial risk, we are migrating portfolios to higher credit quality. We are happy to be conservatively positioned – higher in credit quality, shorter in duration – while we wait for the next opportunity.