

The Blue Jays captured the hearts of Canadians this past season with an improbable run to the World Series. And while it ended with the heartbreak of a Game 7 extra-innings loss, the Jays wasted no time in their efforts to run it back, storming into the offseason with bold roster moves. Canadians are now gearing up for the upcoming Winter Olympics in February, where the return of NHL players to Olympic ice promises a thrilling showdown and a chance to reclaim hockey supremacy. All this evokes a sense of Canadian pride in the face of ever divisive issues. We are certainly operating in an environment of heightened uncertainty, though you wouldn’t know it from looking at financial market results.
Canada Strong??
Canada’s 2025 federal budget, branded “Canada Strong”, was designed to respond directly to heightened uncertainty with the United States and broader global disruption by pivoting toward economic self‑reliance and strategic investment. Faced with tariff pressures that have weighed on exports and business confidence, Ottawa’s plan aims to diversify trade, including an ambitious goal to double non‑U.S. exports over the next decade and invest in trade corridors and infrastructure to support global market access. To support Canadian industries, federal contracting will increasingly emphasize “Buy Canadian” sourcing, while defence and competitiveness measures attempt to fortify the economy against external shocks. All of this comes at a significant cost of course, with Ottawa projecting a sharp increase in the budget deficit. The bond market has taken notice with long term government bond yields continuing to face upward pressure as investors price in an increased supply of debt to come.
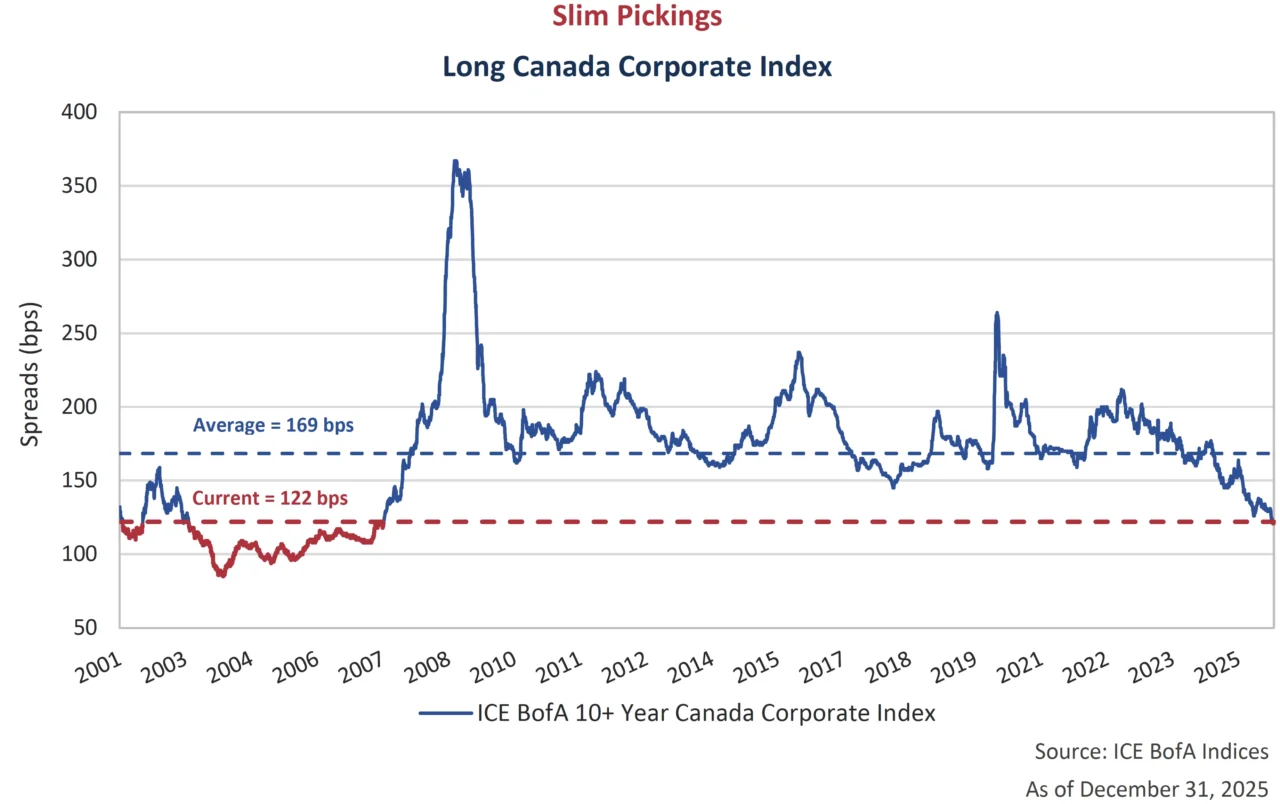
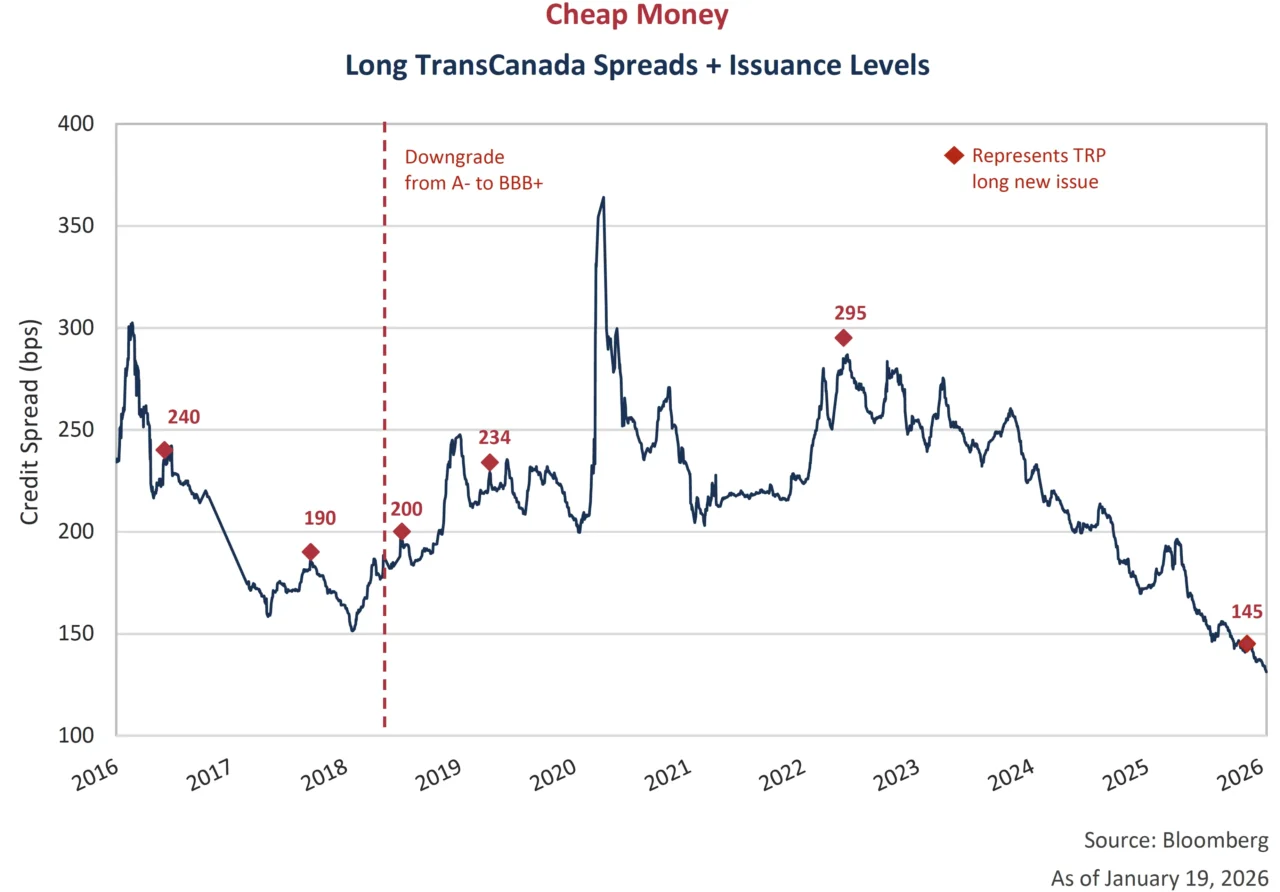
Rising long term government bond yields in Canada negatively impacted bond market performance in 2025. The ICE BofA Canada Broad Index returned just 2.4% in 2025 because of a negative contribution of -1.0% from the long-term bond component. The impact of higher yields was softened by strong performance in corporate bonds. The Canada Corporate Index was up 4.3% for the year with a much better 2.5% contribution from long-term bonds. The graph below plots credit spreads for long-term corporate bonds in Canada. Spreads on long corporates continue to look expensive with levels now comparable to 2007, a time when there were significantly less BBB-rated bonds in the index than there are today.
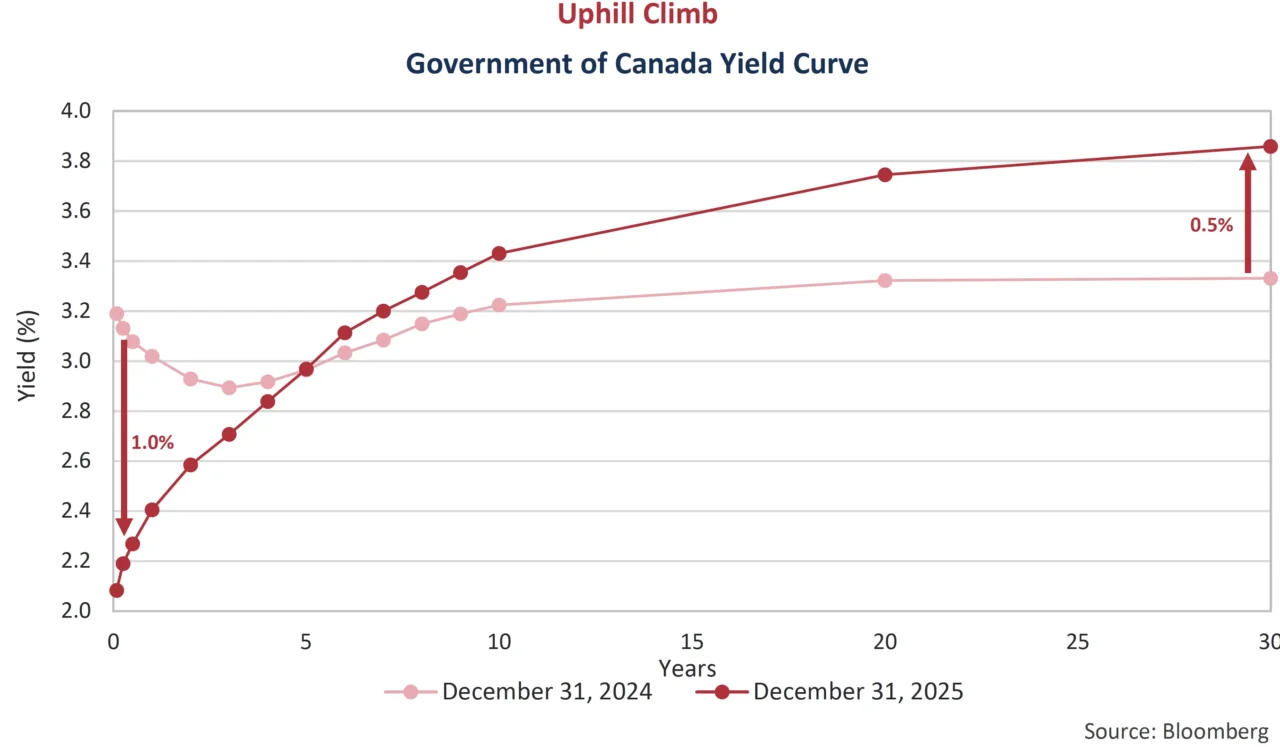
Conversely, the short end of the curve moved in the opposite direction. The Bank of Canada cut rates 4 times in 2025, each time lowering administered rates by 25 basis points (bps). It looks to be on hold for now. The result has been a steepening of the Canadian yield curve, as charted below.
All Right Now
Despite tariff uncertainty, persistent geopolitical tensions, the longest U.S. government shutdown in history, and a host of other macro and policy risks, markets charged ahead, delivering an ‘everything rally’ in 2025, with equities, credit, and select real assets posting broad-based gains. Unusually, both traditional safe-haven assets, and risk-on assets performed strongly at the same time. What was interesting was the divergence in safe-haven performance. The U.S. dollar weakened, while metals soared to record heights. Gold was up 65%, and silver was up an even shinier 148% in 2025. Meanwhile, Bitcoin faced an identity crisis, no longer behaving as a classic risk asset, but also not as a maturing store of value. Instead, Bitcoin finds itself stuck in a middle ground where it has decoupled from its strong correlation with equities, yet fails to benefit from safe-haven demand when there is a flight to safety. For the first time since 2014, Bitcoin fell when the S&P 500 rose, down 6.3% and up 17.9%, respectively.
The Bottom Line
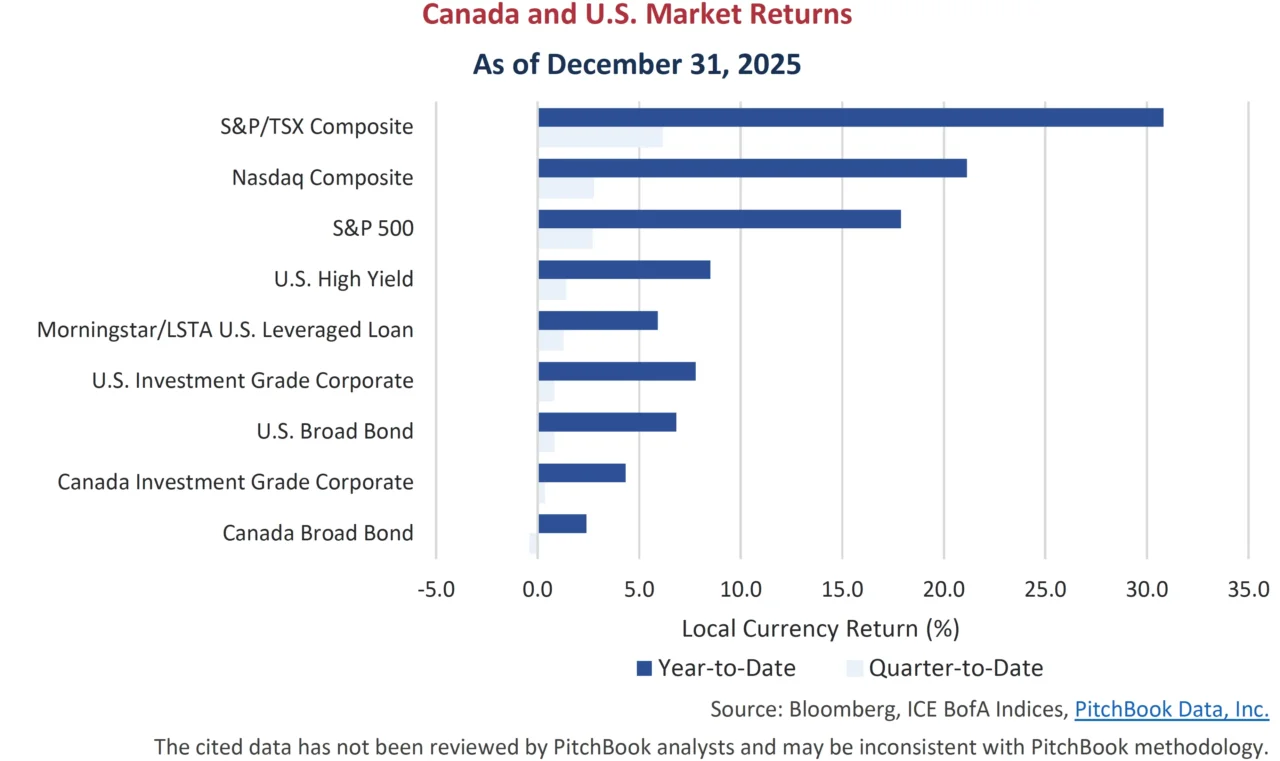
The final quarter of 2025 saw almost all major indices post incremental gains to close out a strong year. The S&P/TSX Composite was the star performer, up 6.1% in the fourth quarter and 30.8% for the year, outpacing its U.S. counterparts in a period that favoured financial and materials sectors. This was only the third time in the past 15 years that the TSX generated a higher annual return than both the Nasdaq Composite and S&P 500 indices, which were up 21.1% and 17.9%, respectively, in 2025. Bonds underperformed equity markets both in the quarter and for the year, but still delivered gains. The exception was the Canada Broad Bond index, which was down -0.4% in the fourth quarter, as government bonds were negatively impacted by a steepening yield curve. Despite negative quarterly performance, the index ended the year up 2.4%. Investment Grade and High Yield Corporate indices did better, returning between 4.3% and 8.5% in 2025, as credit spreads continued to tighten in.
Corporate Action
Risk premiums for investment grade corporate bonds continue to be supported by a persistent demand for yield. In the U.S., credit spreads finished modestly tighter on the year and remain historically expensive. Falling government bond yields helped deliver a strong 7.8% annual return for the U.S. Investment Grade Corporate Index. The story was different in Canada. Although credit spreads outperformed U.S. tightening, rising long-term government yields restrained the Canadian Investment Grade Corporate Index return to 4.3%.
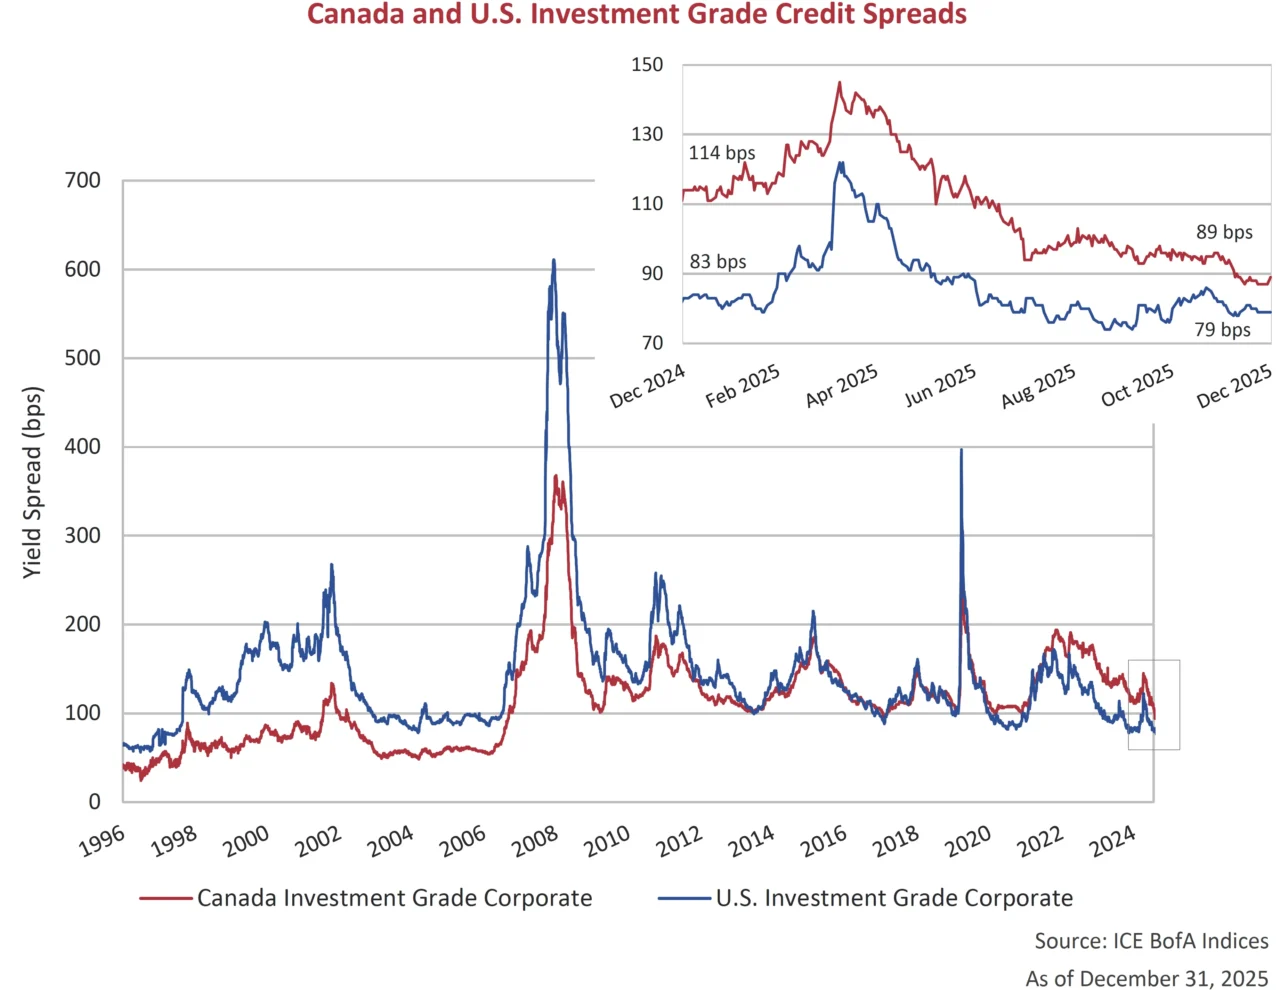
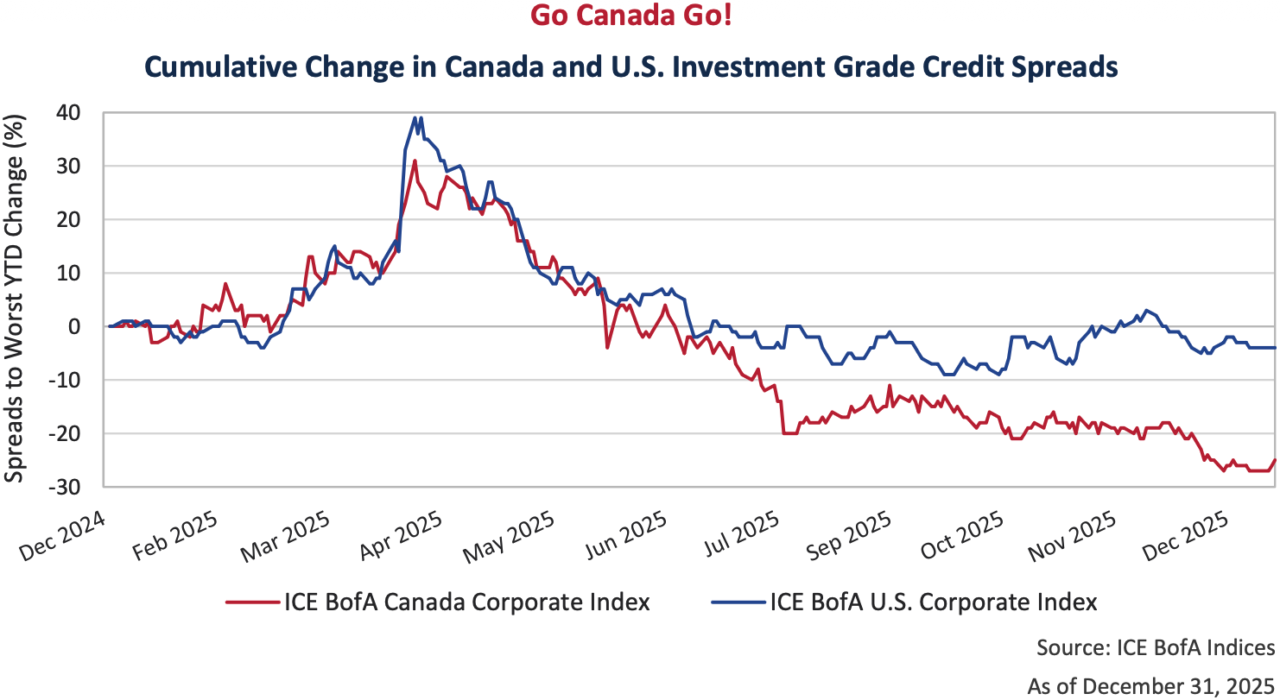
In the graph below, we plot the outperformance of Canadian investment grade spreads in 2025. Although Canadian spreads continue to be wider in absolute terms relative to the U.S., that gap narrowed this past year. The lines below illustrate the cumulative credit spread change in both the Canadian and U.S. investment grade markets throughout 2025. After recovering the Liberation Day widening, the U.S. market has teetered but remained relatively flat. At current levels, U.S. investment grade continues to price at previous cycle tights. In Canada, after retracing, investment grade corporate bonds continued to march quite a bit tighter. In total, Canadian spreads narrowed 25 bps over the year whereas the U.S. narrowed 4 bps.
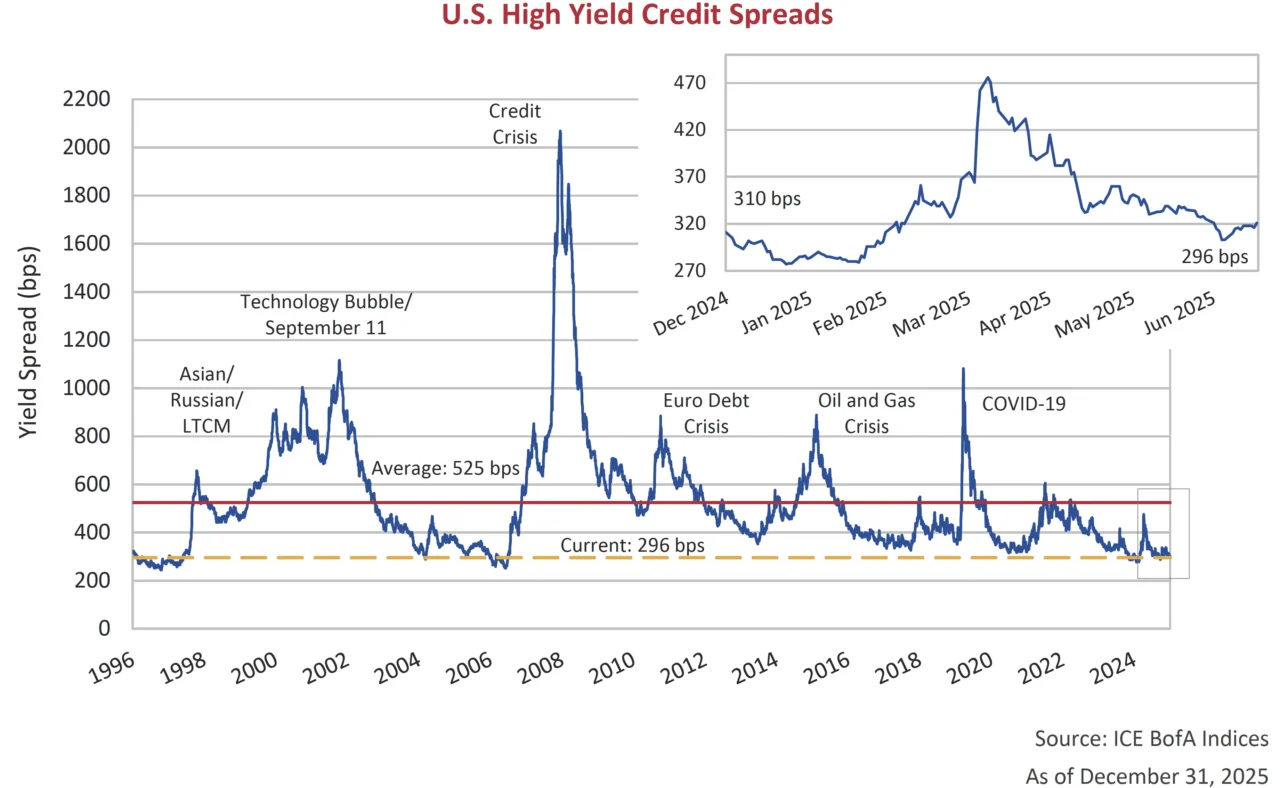
The pursuit of yield continues to extend into lower quality bonds. Looking at valuations of high‑yield bonds, credit spreads remain expensive by historical standards. Spreads ended 2025 at 296 bps, 14 bps tighter on the year. This strength, combined with falling yields, resulted in an 8.5% return for the U.S. high yield index. Investors are having little issue looking beyond the surge in liability management transactions or headline catching defaults. We continue to believe that outside of special situations, the risks in high yield bonds are asymmetric for investors.
More Than A Feeling
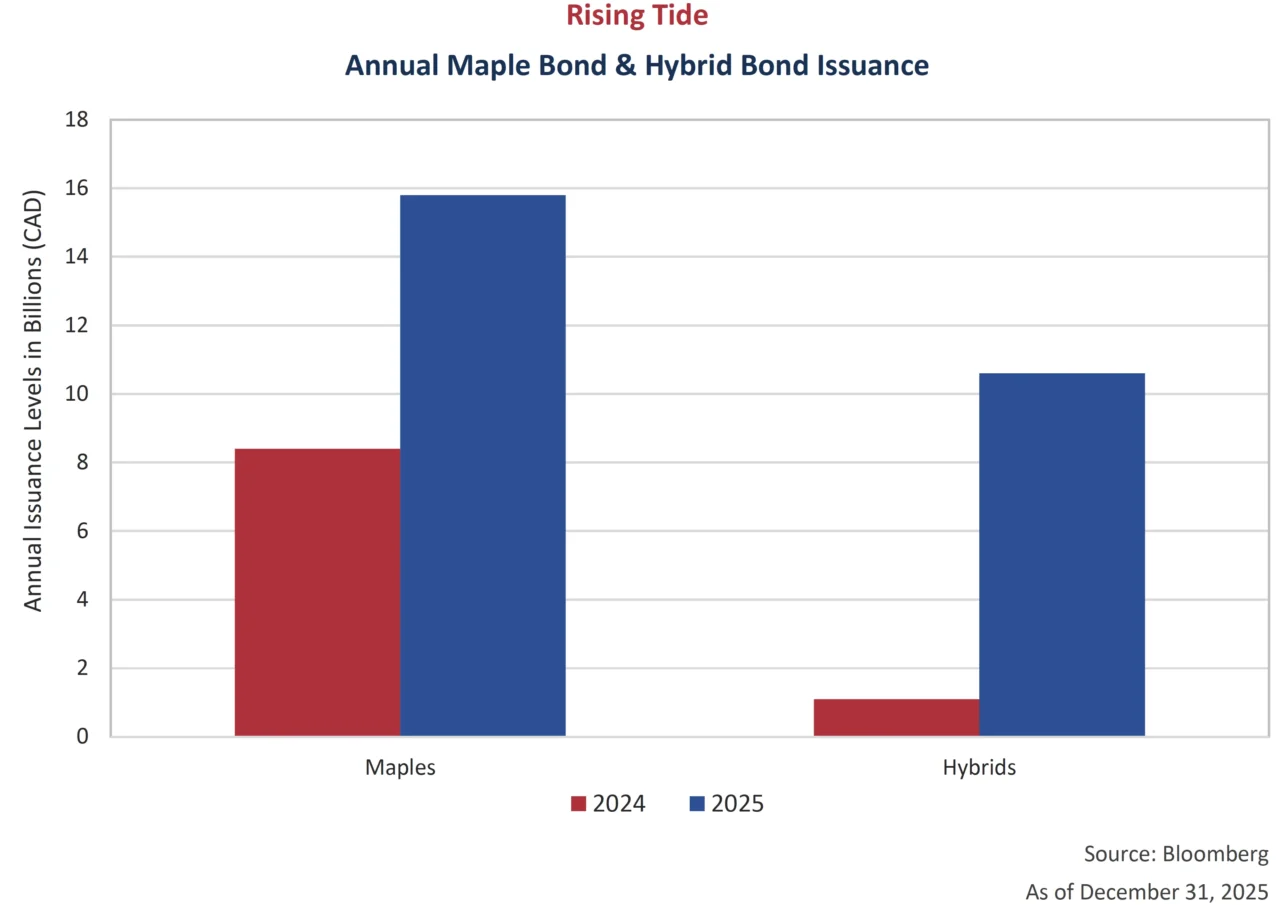
Optimism has investors floating from one new issue to the next. With credit spreads at previous cycle tights, it was a good year to be a borrower, and Canadian companies took advantage. Last year brought record supply to the Canadian market with $160 billion of new issuance, surpassing 2024’s level by $20 billion. The borrowing surge was broad-based, as issuers locked in attractive coupons on favourable terms. An additional record was set in 2025 as 39 inaugural issuers tapped the market. Two particularly strong sectors were maple bonds and hybrid bonds. FTSE Index eligibility encouraged a swell in maple issuance to $16 billion, almost double the 2024 figure. Foreign companies found it attractive to issue in Canadian dollars due to an expanding buyer base, diversified funding markets and lower all-in yields. Meanwhile, hybrid issuance surpassed $10 billion in 2025, matching the cumulative total of the prior 6 years combined!
Our recent Newsletters have highlighted the strength in BBB-rated issues in Canada. This quarter, we take look at a BBB+ rated TransCanada Pipelines new issue from mid-November. The 30-year bonds were issued at spread of 145 bps over the Government of Canada yield, equating to a coupon rate of 5.127%. The issuer last printed a 30-year bond in May 2022, a little over 3 years ago. The new issue spread at that time was 295 bps, double the cost of today’s level. The spread in November represents the lowest spread on a long bond that TransCanada has achieved since 1998, when the company was firmly in the single A rated category.
Return to Sender
In December, BBB-rated TELUS Corporation launched a significant cash tender offer in Canada to repurchase up to $500 million of several series of its outstanding debt, spanning maturities from 2031 to 2051. This followed a successful tender by the company of $1.8 billion of senior debt in June. Bondholder participation far exceeded the initial tender cap as the company offered to repurchase outstanding bonds at up to 15 bps inside of secondary levels. TELUS ultimately upsized the initial $500 million offer, accepting all tendered amounts for five series of bonds totaling $1.1 billion. The successful tender was in large part thanks to financing from concurrent junior subordinated note issuances. Replacing senior debt with junior notes results in lower leverage metrics as calculated by the rating agencies. TELUS’s ability to complete the transaction underscores how receptive markets are to high-grade borrowers, even amid macro uncertainty.
In total, TELUS, Bell and Rogers executed $10 billion of tender offers in Canada and the U.S. in 2025. Of this total, approximately $5 billion was long-term, BBB-rated Canadian corporate bonds. There was $58 billion of Canadian long-BBB bonds outstanding at the start of the year, across all issuers in the market, meaning approximately 9% of the total was taken out by these 3 companies. Tendering for this amount of debt at spreads 15-25 bps inside market levels was, of course, very supportive of secondary spreads. The long-BBB index now sits at a credit spread of 140 bps, 72 bps inside the long-term average. In our view, the risks are asymmetric at these levels. A move back to long-term average spreads would require long-bonds to reprice -10% lower. A move back to previous cyclical peaks would produce a significantly worse outcome.
Learning To Fly
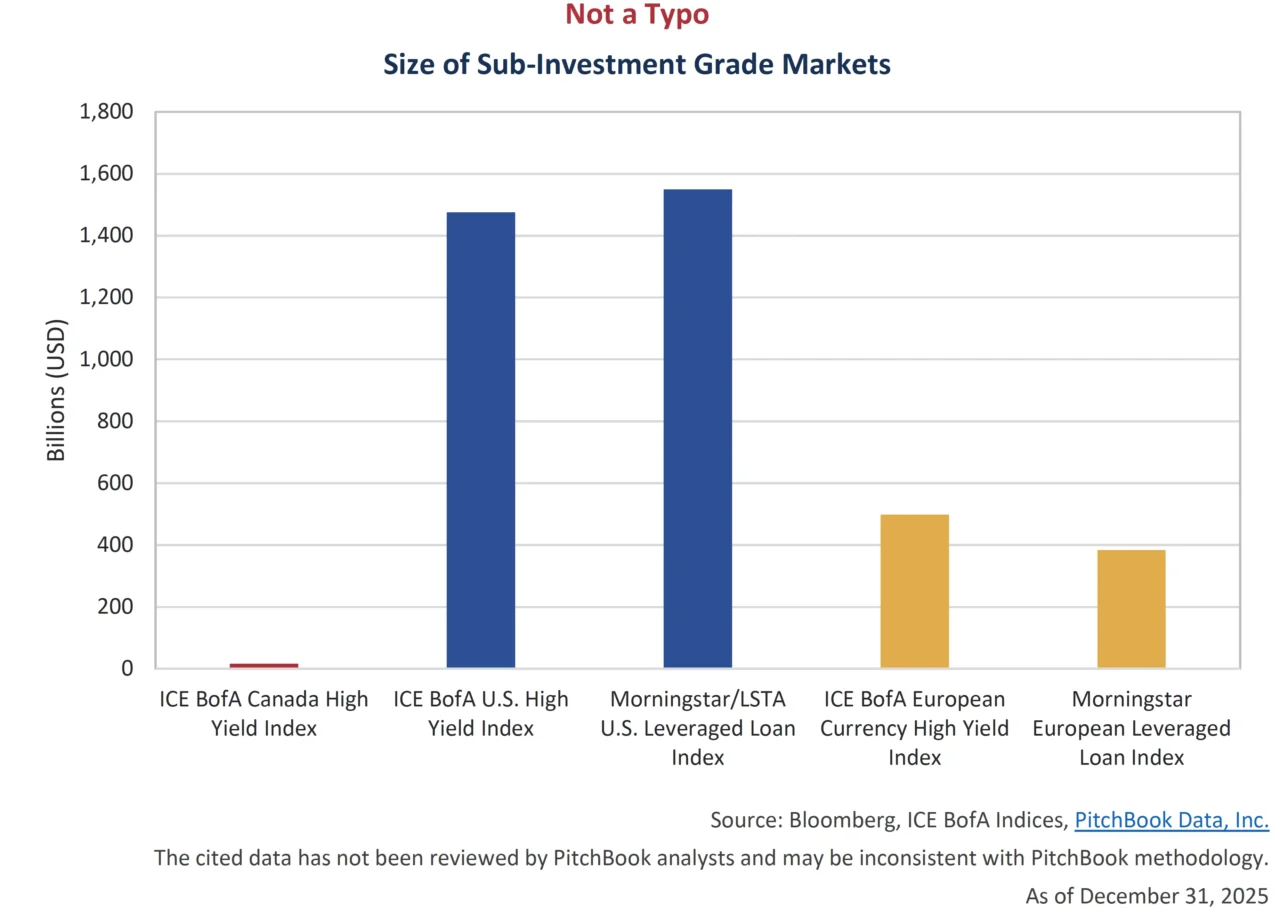
The Canadian high yield market experienced a revival of sorts as new issuance increased to $7.3 billion in 2025, the highest year since 2021’s $9 billion record. A record number of inaugural issuers also came to market, with 11 new names joining the fray. Despite the healthy year, it is still difficult to consider the Canadian high yield space a fully formed market. The Canadian high yield bond market sits at a meager C$23 billion, or US$17 billion equivalent, compared to its U.S. counterpart at US$1.5 trillion and European counterpart at US$499 billion. Furthermore, the U.S. and European levered loan markets, which also include corporate issuers rated BB & Below, contribute an additional US$1.55 trillion and US$383 billion, respectively. Canada does not have a levered loan index.
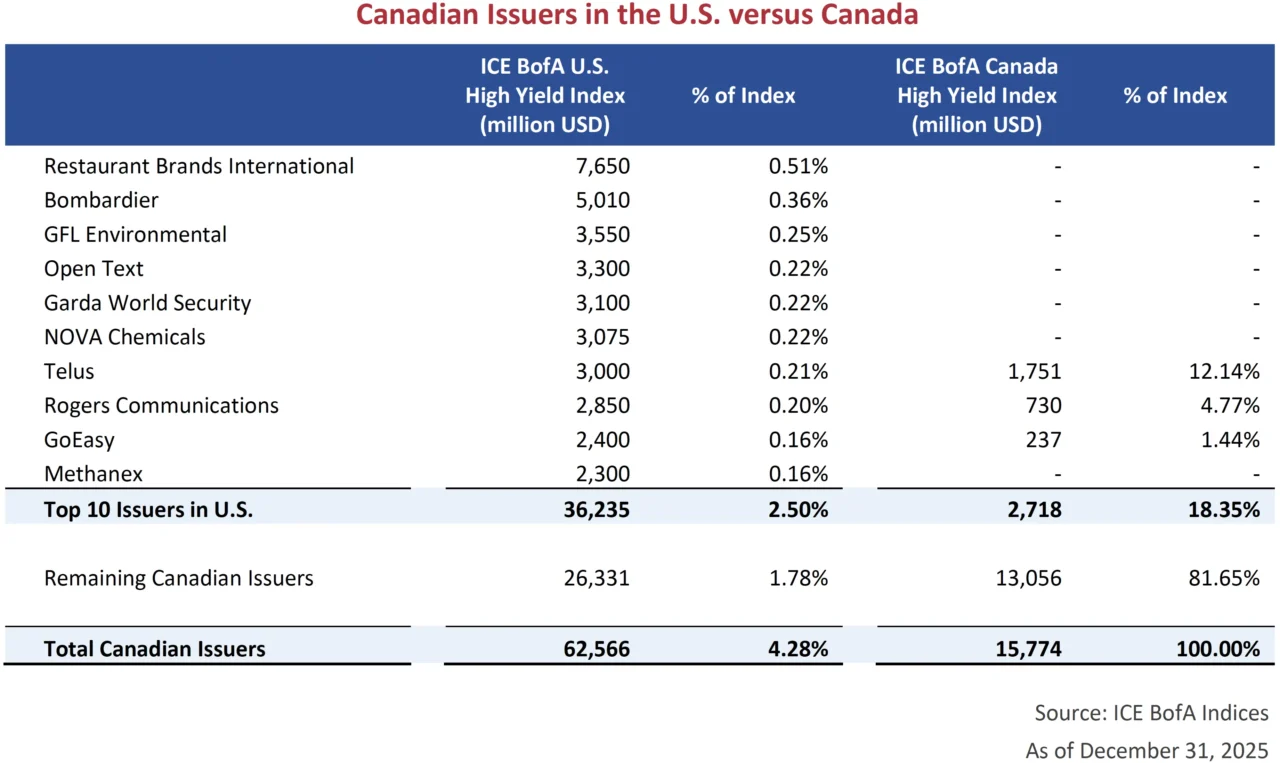
To illustrate the depth of the U.S. market, we just need to look at the number of Canadian issuers that choose to fund in the U.S. market rather than in Canada. In total, there are 45 Canadian companies that are issuers in the ICE BofA U.S. High Yield Index, with debt outstanding totaling US$63 billion. Compare this to 36 issuers in the ICE BofA Canada High Yield Index, with a total of US$16 billion outstanding. To help our readers out with the math, the U.S. market has 25% more Canadian issuers and almost 4x the debt on offer. The table below lists the top 10 Canadian issuers in the U.S. market and compares the total Canadian debt outstanding.
Soft Landing
Spirit Aerosystems exited the U.S. high yield index in December following a turbulent 7-year period. The aerospace manufacturer, that produces fuselages, wings and other structural components, was originally spun out of Boeing in 2005. The company successfully expanded its customer base beyond Boeing, producing complex aircraft parts for Airbus, Bombardier and several defense contractors. In the years that followed the spinoff, business was good, and the company enjoyed an investment grade credit rating.
Despite broadening their customer mix, producing fuselages for Boeing’s 737 program remained a dominant part of their business. When production of Boeing’s 737 MAX-8 was curtailed in 2019 following two fatal crashes, the financial and operational impact to Spirit was significant. As we can see in the chart below, what followed for Spirit was a series of downgrades, sending the issuer’s rating down 7 notches, from BBB- to CCC+.
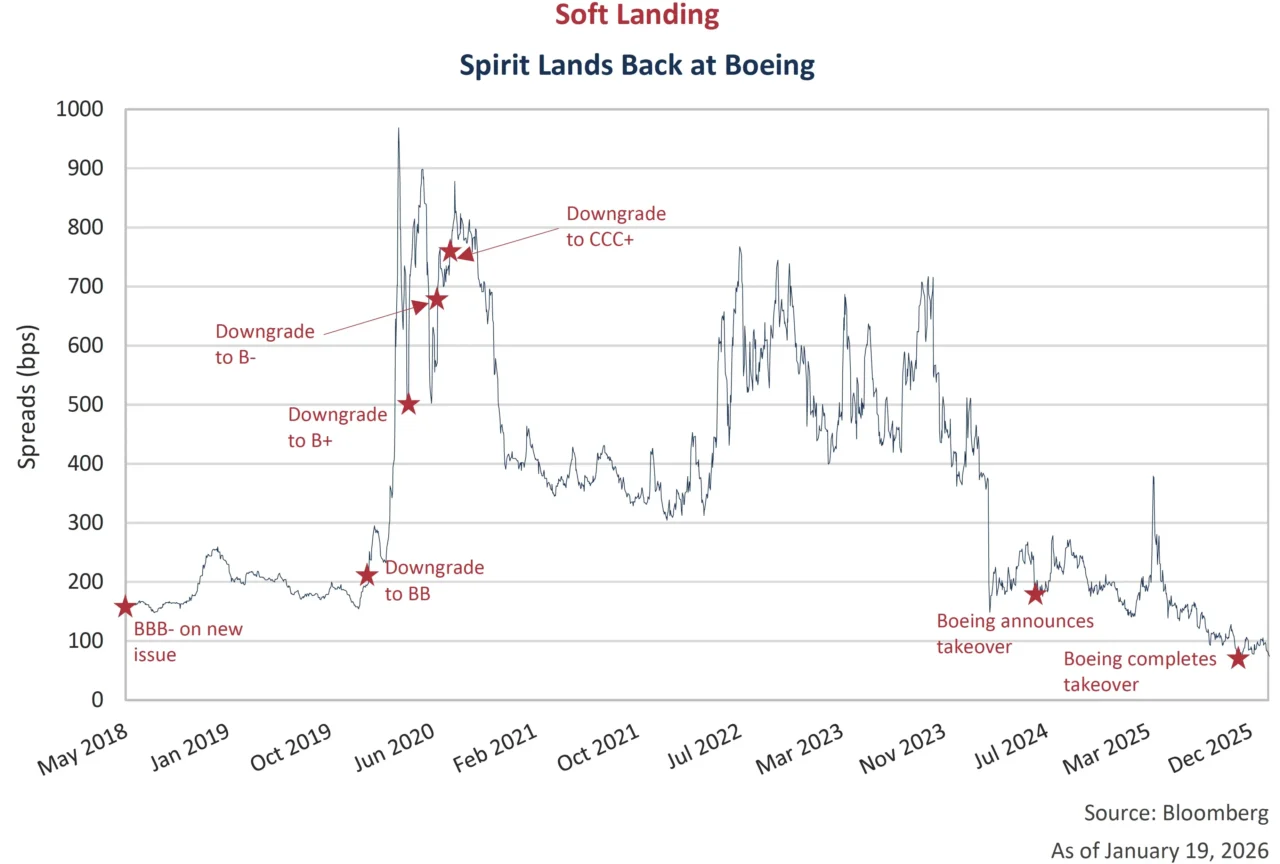
Entering a global pandemic 12 months later only worsened Spirit’s position. Credit spreads on their unsecured issue due 2028 widened 800 bps, sending the bond down over 35% in price. Boeing provided Spirit financial support throughout this period, not wanting a key supplier to go under. But after four years of production interruptions and continued cash burn at Spirit, BBB- rated Boeing made the strategic decision in July 2024 to takeover the supplier. After 18 months of regulatory proceedings, Boeing completed the acquisition this past December. Spirit’s CCC+ rated unsecured bonds now sit under Boeing Co’s umbrella and share the company’s BBB- rating. Spreads have reacted accordingly.
Margin of Safety
Markets were firing on all cylinders in 2025. Stocks continue to touch all-time highs, while credit spreads inch closer to historical tights. Markets appear priced for perfection, as investors ignore downside risks. As we have been saying for some time, the balance of risks is highly asymmetrical. Benjamin Graham called it “Margin of Safety”.
At Canso, we are firm believers in the credit cycle. Calm markets instill confidence which leads investors to accept higher risks at tighter spreads. Tighter spreads lead borrowers to take on higher leverage and aggressive growth. Optimism grows, skepticism fades and the cycle continues. Until it doesn’t. We are building liquidity in our portfolios today so that we will have the freedom to act with conviction when the cycle turns – whenever that may be. As Morgan Housel states, “We tend to be good at predicting the future, except for surprises – which tend to be all that matter.”