

The Corporate Bond Trifecta
One of the most basic choices for investors when building a balanced portfolio is whether to invest in government bonds or corporate bonds1. Intuitively, the thought is government bonds are more appropriate for risk-averse investors and corporate bonds are for the less risk-averse. The intuition largely stems from the fact that government bonds are classified as “risk-free” investments, while corporate bonds require investors to assume what is known as “credit risk”2.
However, analyzing return and yield characteristics data over the past 33-years3 has shown that corporate bonds have been superior to government bonds in terms of generating the following characteristics:
(1) yield;
(2) capital preservation; and
(3) more “efficient” balanced portfolios
(1) Better Yield
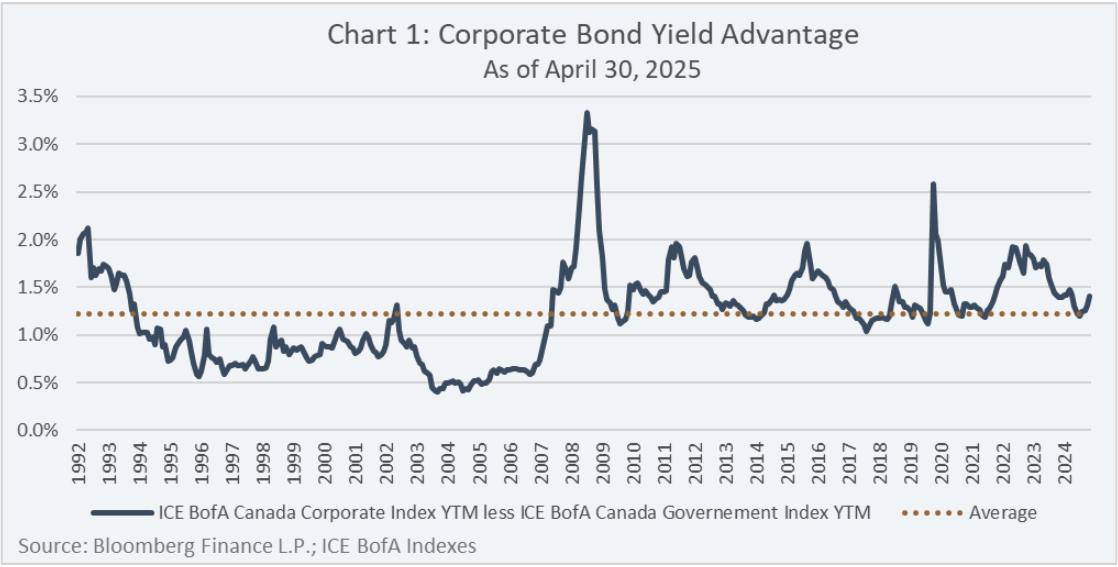
Chart 1 shows the yield advantage of corporate bonds relative to government bonds was 1.4% as of April 30, 2025, slightly above the average historical yield advantage of 1.2%, over 33-years.
The yield advantage of corporate bonds has dual benefits for risk-averse investors: first, a potentially higher expected return over the duration of its portfolio; and second, a potentially greater downside protection buffer should bond prices experience negative volatility.
(2) Better Capital Protection
The “risk-free” characterization bestowed to government bonds can be misleading as it only refers to credit risk, and the risk of permanent capital impairment. Investors can still lose money in government bonds over shorter time periods if they don’t hold the bonds to maturity. This is because both government bonds and corporate bonds are subject to “interest rate risk”4.
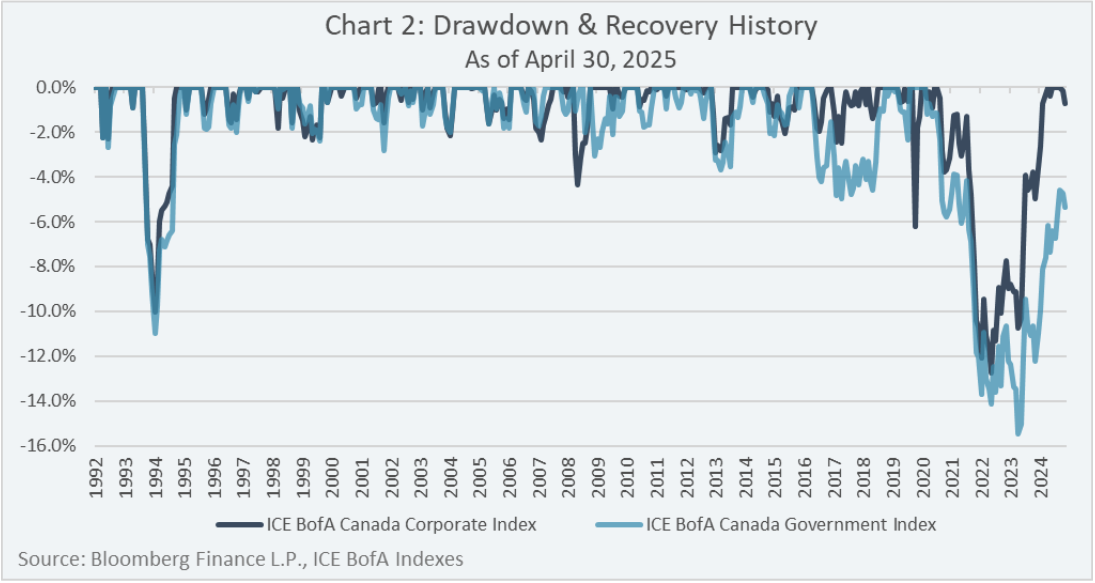
As illustrated in Chart 2, corporate bonds have shown better capital preservation characteristics than government bonds based on shorter-term price fluctuations. The average drawdown for government bonds and corporate bonds was 2.1% and 1.3%, respectively, and the average length of the drawdown period was 7.4 months and 6.4 months, respectively, over the past 33-year period. Furthermore, the most recent drawdown period for government bonds, which started in August 2020, has still not fully recovered, while corporate bonds recovered from the same drawdown period in September 2024.
In summary, corporate bonds, on average, have had smaller drawdowns and shorter drawdown periods compared to government bonds.
(3) More Efficient Portfolios
Modern Portfolio Theory teaches us that investors should not aim to achieve the highest absolute returns with their investment portfolios, rather, their investment portfolios should maximize return for a given level of risk5 – these are known as “efficient portfolios”.
When you plot different efficient portfolios at multiple levels of risk on a scatter chart (returns on the Y-axis, standard deviation on the X-axis), it forms what is known as the “efficient frontier”. Investment portfolios using the same underlying investments that fall below the efficient frontier are known as “inefficient portfolios”, because a greater return could be achieved at the same level of risk by changing the allocation to the underlying investments.
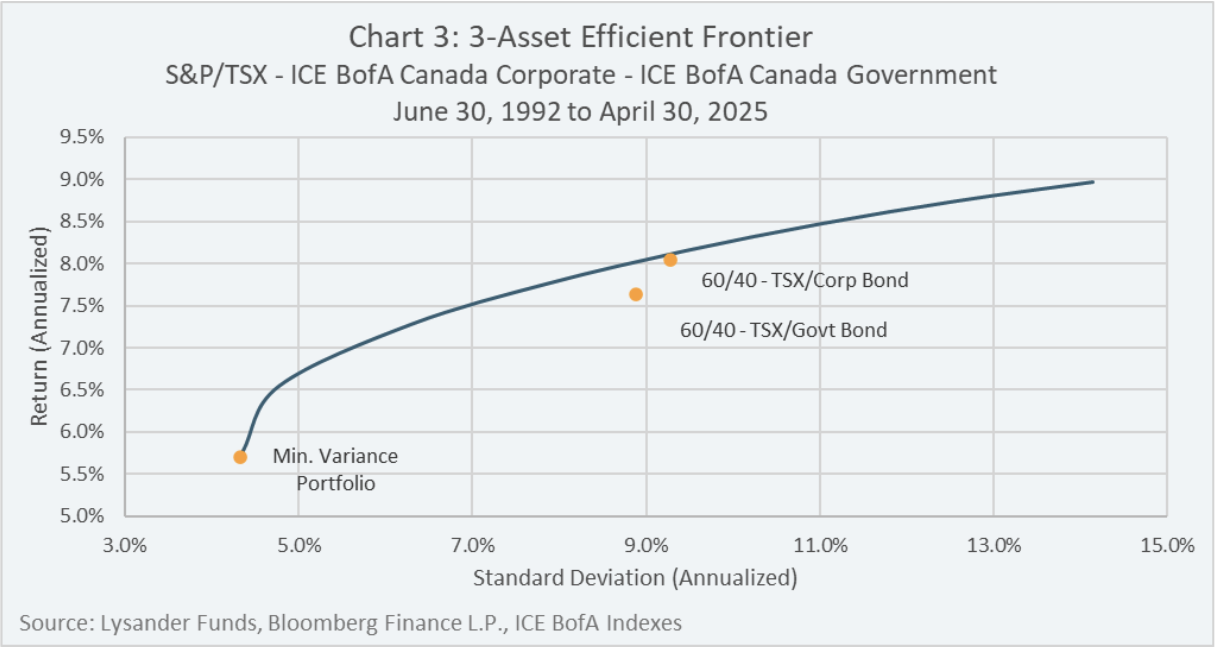
Chart 3 plots the efficient frontier using the following three investments over a 33-year time period ending April 30, 2025:
- S&P/TSX Total Return Index,
- ICE BofA Canada Corporate Bond Index and
- ICE BofA Canada Government Index.
What is notable in Chart 3 is that a “60/40” balanced portfolio using the S&P/TSX Total Return Index as the 60% equity component is more efficient when the ICE BofA Canada Corporate Index is used as the 40% bond component rather than using the ICE BofA Canada Government Index as the 40% bond component.
Furthermore, the only portfolio on the efficient frontier that had any exposure to government bonds was the “Minimum Variance Portfolio” – the efficient portfolio that generates the lowest absolute level of risk. All other points on the efficient frontier were generated using combinations of the S&P/TSX Total Return Index and ICE BofA Canada Corporate Bond Index, without the need for government bonds.
In summary, corporate bonds contributed more to efficient portfolios than government bonds.
Conclusion
Although counter-intuitive, the historical data has shown that corporate bonds did well, even for risk-averse investors, compared to government bonds, as corporate bonds have delivered better yield, better capital protection and more efficient balanced portfolios.
It should be acknowledged that the analyses conducted for this paper were done using the returns of passive broad market indexes. Active portfolio managers who tactically allocate to different asset classes and/or individual securities could derive different results than what were presented in this paper.
1 For the purpose of the paper, “corporate bonds” refers to the ICE BofA Canada Corporate Bond Index and “government bonds” refers to the bonds in the ICE BofA Canada Government Bond Index.
2 “Credit Risk” is the risk that a corporate bond issuers defaults over the life of the bond.
3 References to the time period “33-years” covers the time period June 30, 1992 to April 30, 2025.
4 “Interest Rate Risk” is the risk that the prevailing level of interest rates change over the life of a bond.
5 “Risk” is measured by standard deviation of returns.