

Lookin’ Out My Back Door
In December 2019 we wrote:
“If the rates markets, or the credit markets, or both reprice, we expect there to be some extraordinary opportunities in investment grade, high yield and leveraged loan markets. It is difficult to predict when these repricing events will occur. We are confident markets remain cyclical. At some point securities which are expensive today will become less so, possibly much less so, and Canso will be ready.”
12 months seems a lifetime ago. Then, across all portfolios, including those with allowances to invest in high yield, we were very conservatively positioned. In expensive markets, capital preservation and liquidity is our imperative. Canso takes risk when our investors are compensated for that risk. We did not predict COVID-19 and the resulting market volatility, but we were positioned to seize on the significant opportunities presented across the credit markets.
The Bottom Line
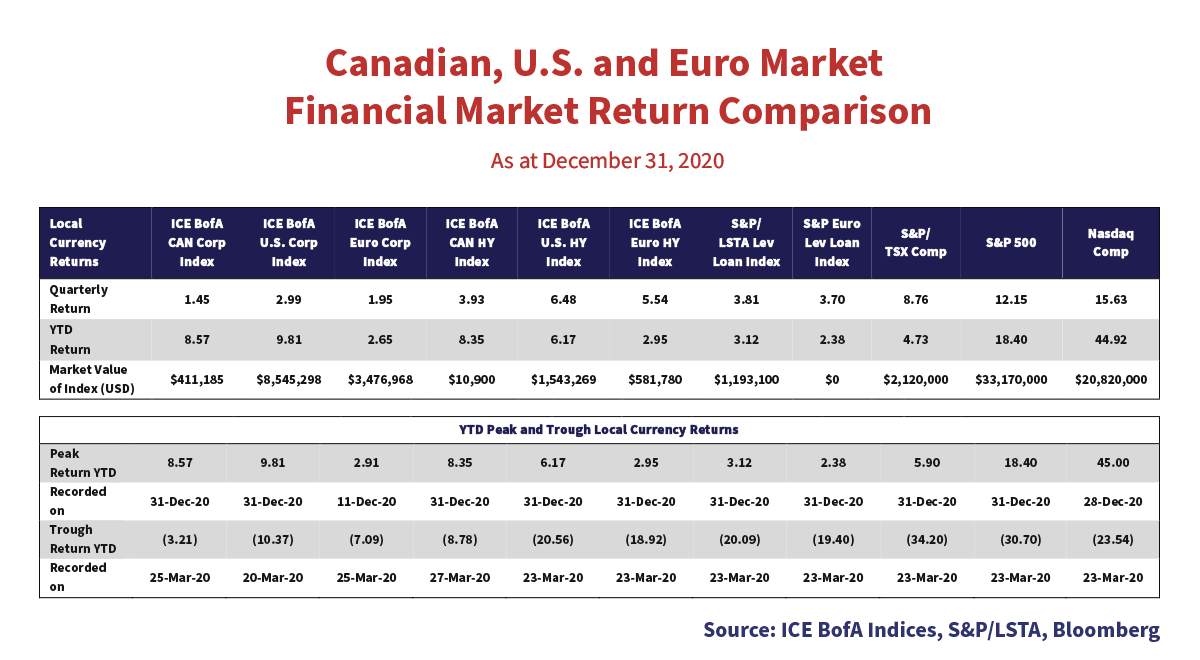
The velocity with which markets moved from expensive to distressed, and life from normal to upside down, astounded. Securities crossed from expensive to cheap, not bothering to stop at fair value. In a few short days, the U.S. investment grade corporate market gapped to a 10.37% loss with high yield and leveraged loan markets plummeting over 20%. Major equity markets fell even more.
On March 23rd, the Fed arrested the financial market freefall with a series of announcements including unprecedented support for primary and secondary credit markets. Financial markets bounced off the bottom, liquidity returned and the rally was on. Risk premiums for investment grade and high yield bonds, which had reached levels not recorded since the latter days of the Credit Crisis, gapped tighter.
Investment grade indices benefitted from recovered credit spreads and falling benchmark yields generating 8.57% and 9.81% annual returns in Canada and the U.S., respectively. U.S. high yield returned 6.17%. Even the embattled, considerably less liquid, leveraged loan markets recovered to generate positive returns. The year-end positive performance across markets concealed the extraordinary volatility markets and investors experienced during 2020.
Similar But Not Identical
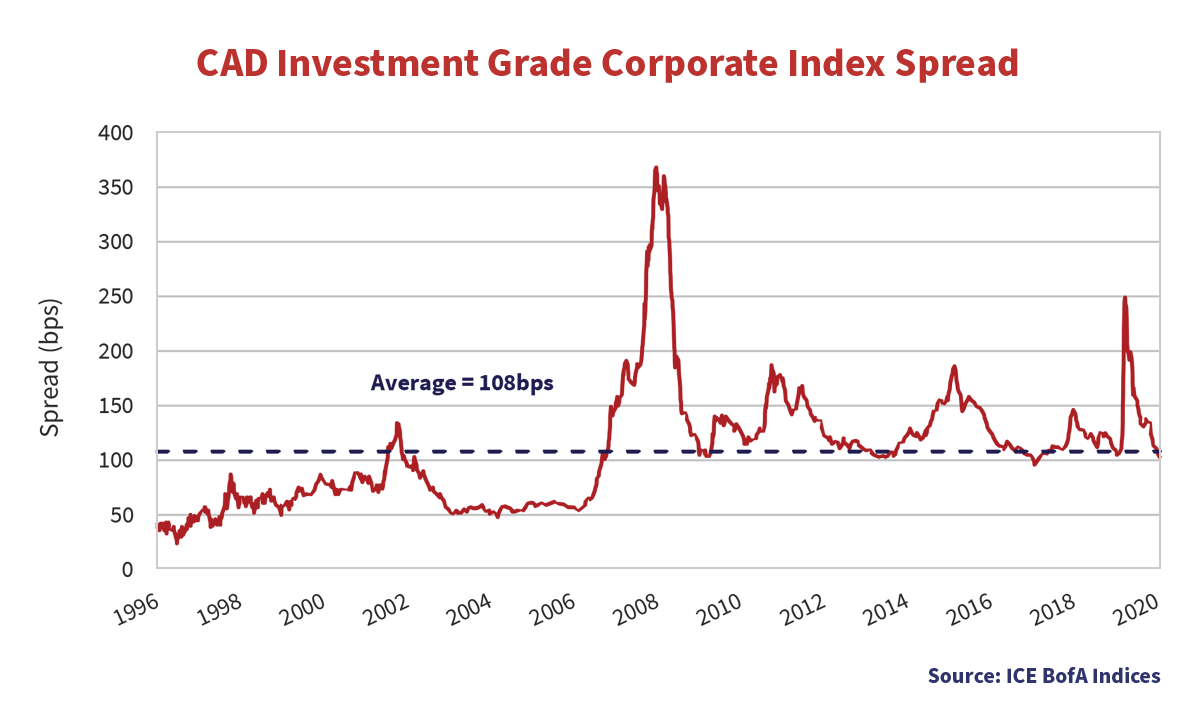
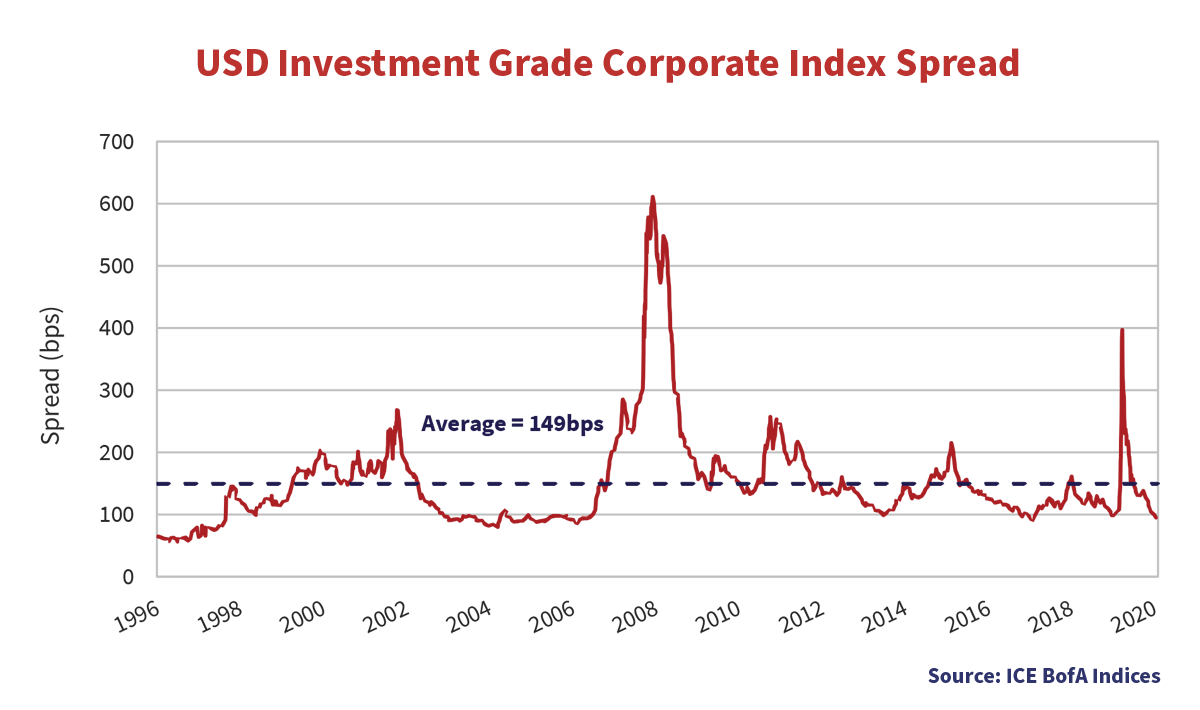
A year ago, the average Canadian investment grade bond yielded 106bps more than a similar term Government of Canada bond, or, in non-financial terms, about normal. U.S. investment grade spreads were 107bps higher than a comparable U.S. Treasury security, or 42bps tighter than long term averages. By March 23rd, Canadian corporate spreads stood at 240bps, 134bps wider, and U.S. investment grade spreads gapped 290bps wider.
Liquidity in Canadian corporate bonds evaporated for several days while trade in U.S. markets continued. The Canadian credit market stubbornly refused to accept that risk premiums had repriced substantially and instead of trading, opted to shut down for a period. The lack of liquidity in the Canadian corporate bond market and the inability to trade ended up damaging Canadian prices less. Following a series of Fed announcements on March 23rd, investment grade spreads began a rapid compression and liquidity returned in Canada. At the end of 2020, credit spreads stood almost exactly where they started.
A Tale of Two Markets
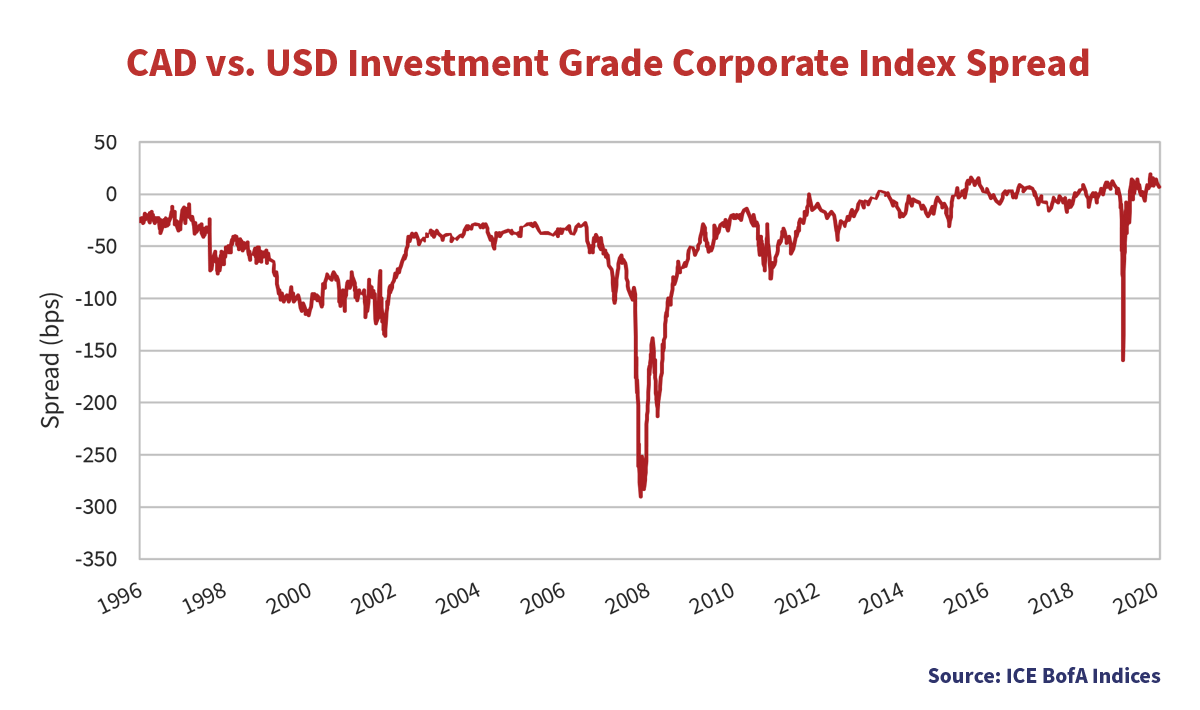
The graph below depicts the differential in Canadian and U.S. investment grade credit spreads. The Canadian investment grade average of 108bps is substantially through the U.S. average of 149bps. Explanations include the higher weight of Canadian financials in the index versus the U.S. and the resultant higher credit quality of the Canadian index. As the credit composition of the Canadian market converged versus its larger U.S. cousin, so too have spreads. However, during times of extreme volatility, Credit Crisis and COVID-19 crisis most notably, the graph highlights the extreme divergence in pricing between the two markets. As indicated, we suggest this is the result of an evaporation of liquidity in Canada and not the resilience of the Canadian market.
Liquidity in New Issues
As the virus spread, desperate corporate treasurers responded by raising hoards of cash to replace disappearing revenues and to shore up investor confidence in the solvency of American businesses. The result, record investment grade and high yield issuance in the U.S. credit markets.
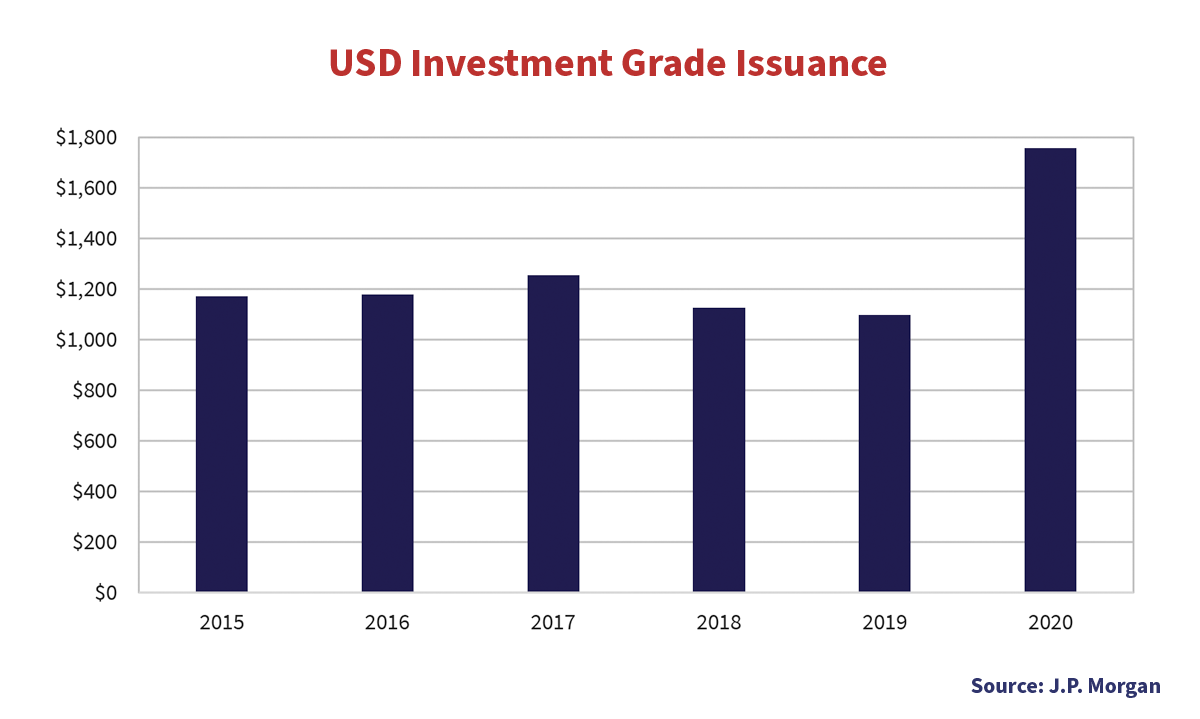
The chart above shows in 2020 investment grade issuers raised over $1.7 trillion in new issue money. New issue activity in the U.S. resumed even before the Fed announcement on March 23rd. Remarkably, as the Canadian corporate market all but locked-up, borrowers were able to raise $290 billion in the U.S. market in the three weeks ended March 30th, 2020. Deals priced in the early days of the pandemic included some of the largest ever – $25 billion by Boeing Co., $20 billion by Oracle Corp. and $19 billion by T-Mobile U.S. Inc.
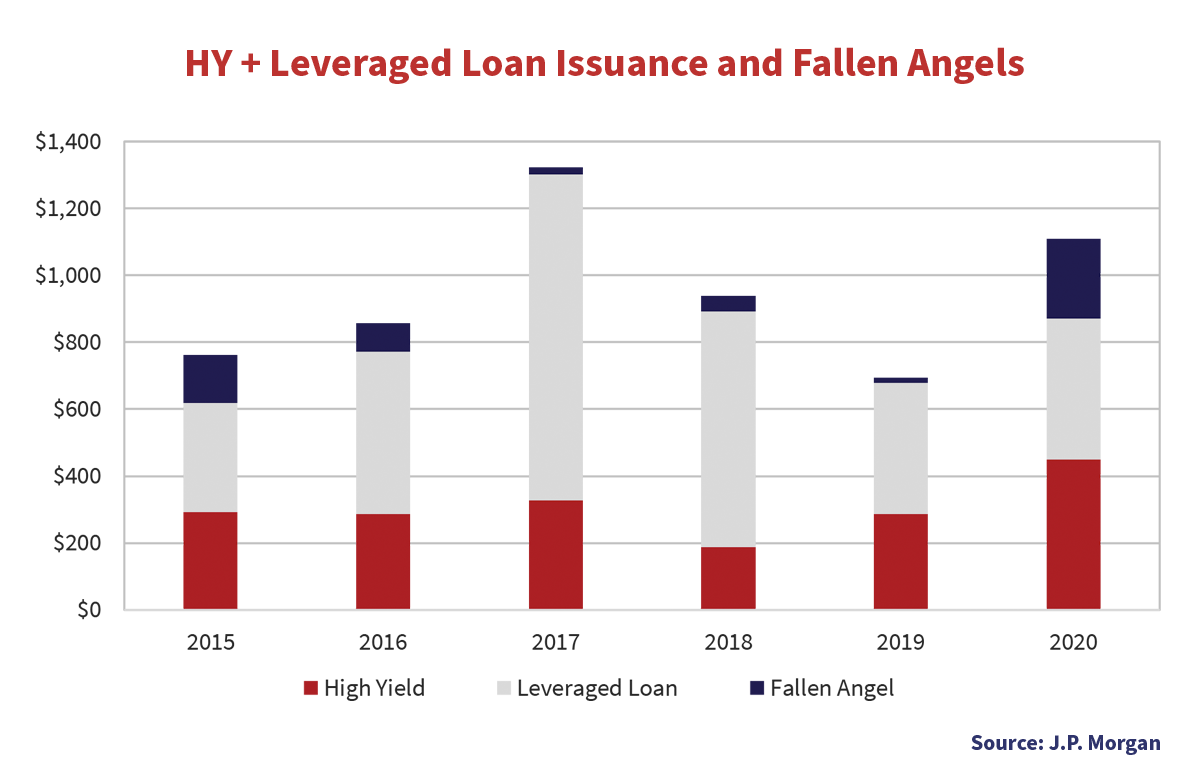
New issuance for lower quality credits shut for several weeks, with only $4 billion in high yield deals priced in March. Markets eventually reopened, allowing even the most dubious of lower quality credits to borrow money. In 2020, high yield bond issuance totaled $450 billion and leveraged loan issuance $422 billion.
Size of the Credit Markets
Despite the pandemic, investors opened up their pocketbooks and provided enormous amounts of financing through the new issue markets to companies in Canada, the United States and Europe. Using the ICE Corporate and the S&P LSTA Loan indices in USD, the par value of corporate bond and loans expanded 13% in 2020.
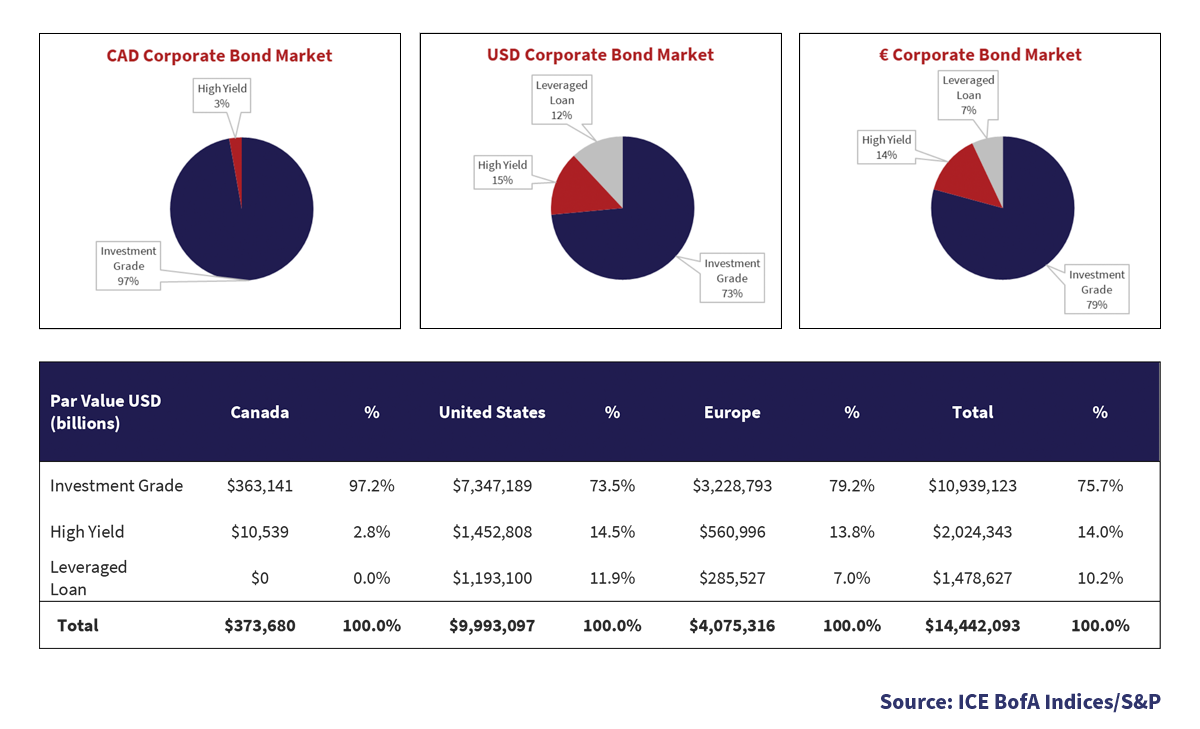
Investment grade credit markets expanded 12%, fueled by the new issue boom which more than offset the reduction caused by fallen angels leaving those indices. Rating agency downgrades, coupled with a rebound in new issue activity in the second half of the year, drove a 27% expansion in high yield bond markets. The leveraged loan markets grew a modest 3% in 2020 as the March market selloff dented investors’ enthusiasm for CLO formation, the prime driver of leveraged loan activity.
Uptight (Everything’s Alright)
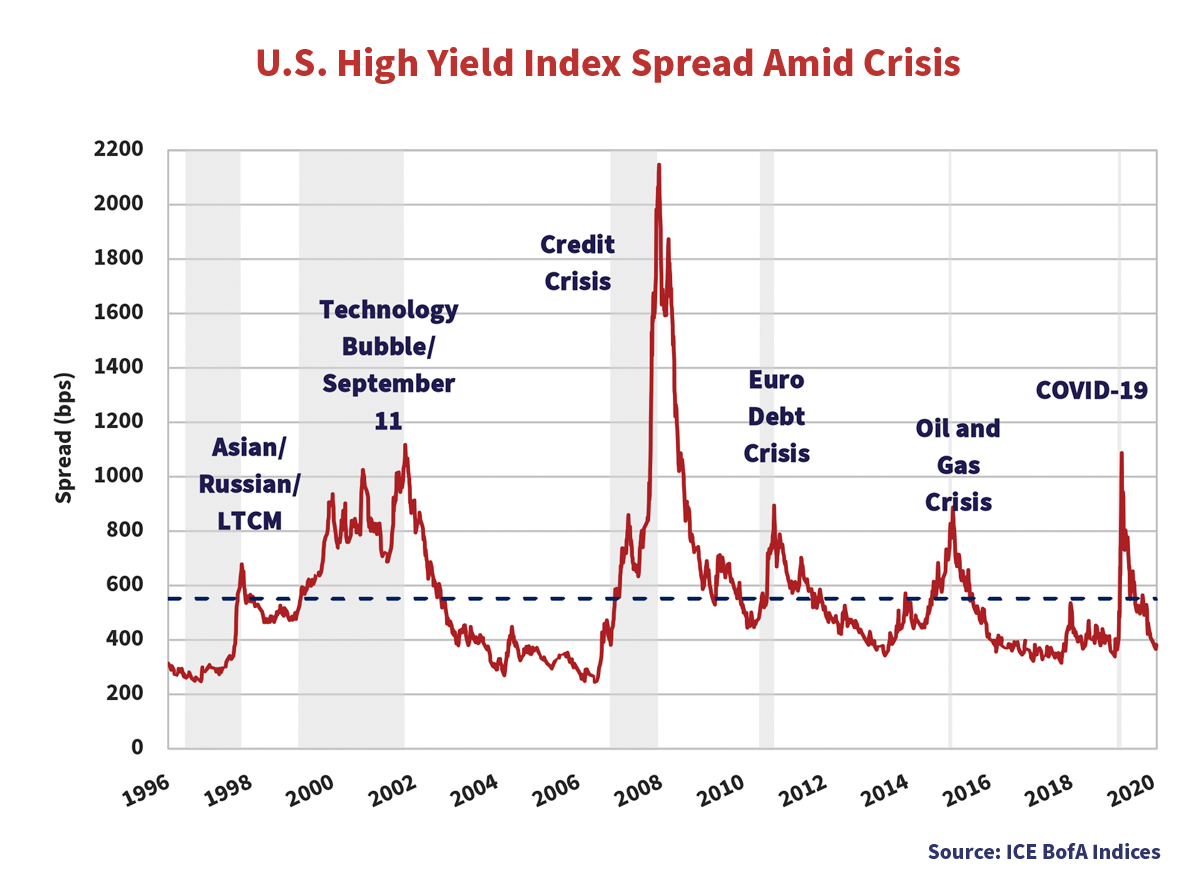
From the wide spread of 1,082bps on March 23rd, high yield spreads took only four days to retrace 25% of the widening. The rapid retracement followed the Fed announcement that certain fallen angels were eligible for purchase as part of its market support programs. It took only 58 days to retrace 50% of the widening. The opportunities in times of crisis are significant, but with each successive crisis, the window to take advantage of those opportunities is shorter and shorter.
Underwritten by the Fed, credit and equity markets steadily recovered over the balance of 2020. By the end of the year, investment grade credit spreads were unchanged versus where they started – belying the volatility of the March period. The combination of accommodative monetary policy, fiscal stimulus and consumer spending should underpin credit markets for much of 2021, if not beyond. As the markets anticipate a post pandemic world, we expect risk premiums in investment grade and high yield to continue to contract. We also believe securities most impacted by the pandemic continue to have room for outperformance relative to the broader market.
As positive as these factors are for corporate credit, they heighten the likelihood of rising inflation, which is negative for long duration non-credit assets. Not all fixed income is created equal and we remain cautious on long duration government and provincial securities. The risks of rising longer term interest rates are real and the capital erosion caused by rising longer term interest rates could be devastating for those thinking they are in a “safe” investment vehicle.
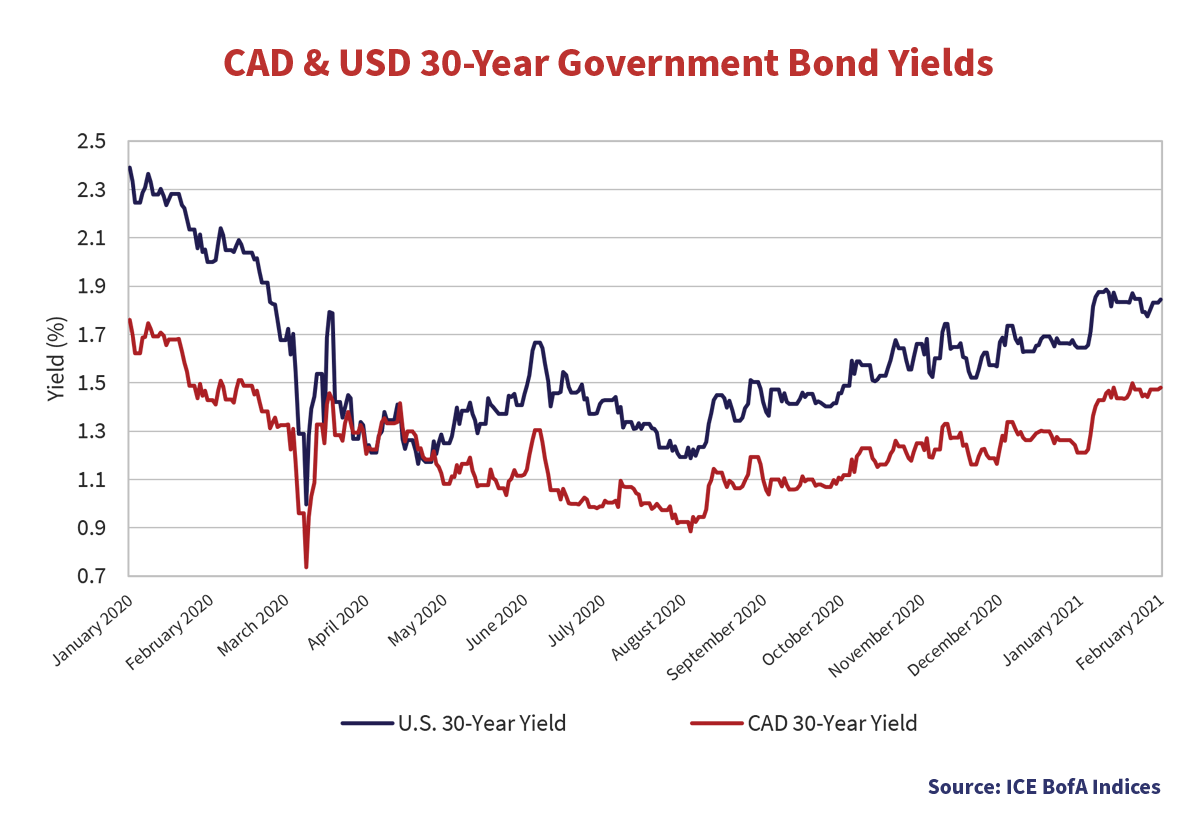
While You Were Watching Netflix
A gradual elevation in longer term government bond yields is underway. Since bottoming in March, Canada and U.S. Treasury yields have moved higher and today are at their highest levels since last March. While the Bank of Canada and the Federal Reserve control administered rates, ultimately the market determines rates further out the yield curve. With massive government bond supply and the risk of higher inflation, the market is suggesting the path for long term rates is higher, not lower.
Someday We’ll Be Together
We expect continued contraction in investment grade and high yield credit spreads driven by a sustainable and substantial economic recovery. A recovery fueled by the liberating impact of widespread vaccination, followed by an unprecedented economic boom as the world catches up on all it missed during lockdown.
We expect credit spreads could trade well through historic averages for an extended period. Credit metrics for companies most impacted by the pandemic will improve as customers and revenues return, driving spread compression. Financial markets will benefit from central banks’ accommodative monetary policy and the acceptance of higher than target inflation. Governments’ fiscal policies will err on the generous side, providing an additional economic catalyst. Finally, enormous debt issuance by investment grade and high yield companies in 2020 is unlikely to be repeated.
Risks abound. Companies may choose to run with higher levels of leverage. Bankruptcies will remain elevated and not all companies will live long and prosper. Credit markets will continue to overestimate some – providing money too cheaply with too few restrictions. Canso mandates will continue to be driven by our bottom-up fundamental research process. Although in the aggregate credit spreads have tightened substantially, we expect opportunities to continue to present themselves.