

The Day the Music Died
Historically, war or a large corporate insolvency, or both occurring at the same time, would have roiled the global capital markets. The invasion of Ukraine and the Evergrande restructuring are impacting asset prices to a degree. That said, the primary focus of financial markets remains the policy response, or lack thereof, of the world’s central banks to substantially higher than target inflation.
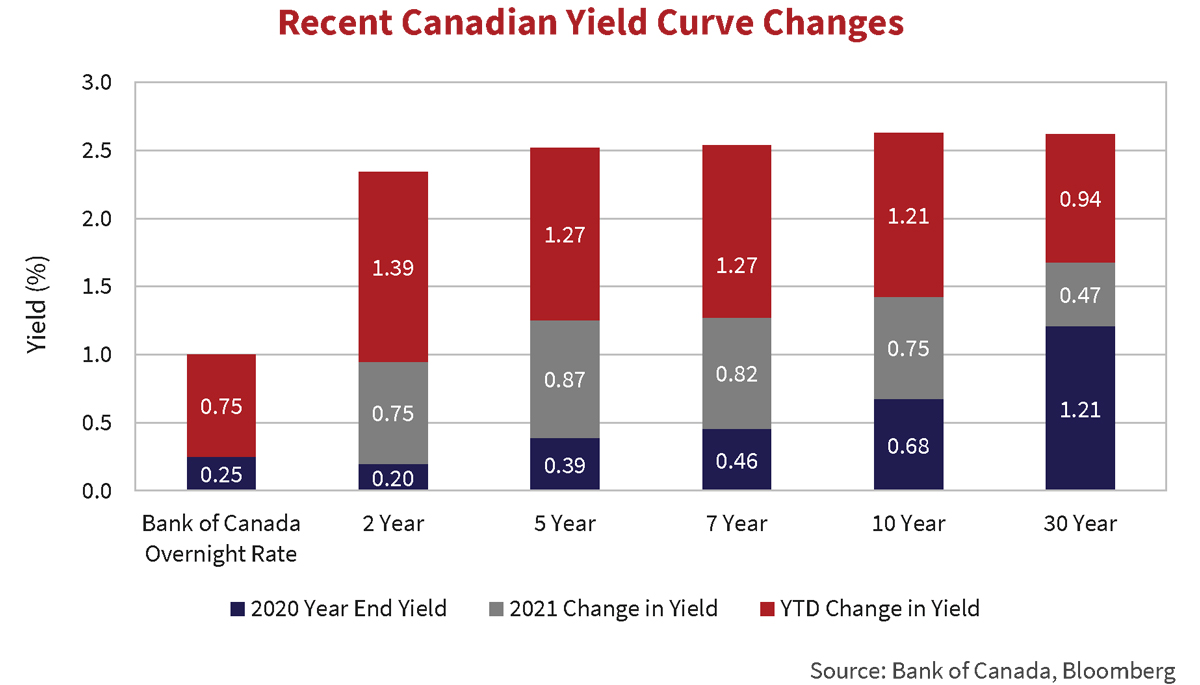
The chart above highlights the dramatic move higher in Canadian government bond yields over the last 15 months. The stacked bars begin with bond yields at the end of 2020 (the dark blue segment), then add the yield change in 2021 (grey), and finally add the move in yields year to date in 2022 (red) up to the morning of April 13th. The Canadian bond market moved substantially higher in anticipation of much more aggressive policy action by the Bank of Canada. Yield movements in the United States and other developed economies are similar in direction and magnitude.
Minutes to Memories
On March 2nd and March 16th, the Bank of Canada and the Federal Reserve increased overnight rates 25 basis points to 0.50%. On April 13th, the Bank of Canada raised overnight rates 50 basis points to 1.00%. History books will show the official end of emergency monetary policy accommodation to offset the Covid-19 pandemic came on those dates in 2022. In reality, the recalibration of bond markets started well beforehand, in response to inflation, and in anticipation of central bank action.
At 5.7% and 8.5%, inflation in Canada and the United States stands at levels not seen in decades. In late 2021, in a series of speeches and announcements, the Bank of Canada and the Federal Reserve expressed growing concern over persistently above 2% target inflation. News the Fed planned to announce plans for its balance sheet unwind, having only stopped buying bonds in early March 2022, added to upward pressure on bond markets.
The release of January’s FOMC minutes did little to calm jittery markets. In the minutes, officials discussed plans to reduce the Fed’s $8.5 trillion balance sheet. The conclusion, an unwind of $60 billion of U.S. Treasuries ($5.8 trillion in holdings) and $35 billion of Mortgage-Backed Securities ($2.7 trillion in holdings) per month was appropriate. This compares to a high of $30 billion and $20 billion per month in the post Credit Crisis unwind. Further, the previous unwind did not start until 3 years after the last asset purchase under the program. The formal announcement is expected at the May 4th meeting with a rapid stage-in thereafter.
Long gone are market expectations of a series of gradual hikes in 2022 and 2023. In their place, a series of back-to-back hikes, likely at all remaining scheduled meetings this year, including possibly, 50 basis points at several meetings coupled with a faster than previous balance sheet runoff. Whatever policy implementation path central banks choose it is almost certain overnight rates will end 2022 at or near 2% barring some unforeseen market calamity.
Everybody Hurts
The movement of bond yields higher across global markets dramatically impacted one of the anomalies created by the emergency monetary policy tool known as quantitative easing. Massive securities purchases by the European Central Bank and Bank of Japan over the last decade drove yields on a large portion of government and corporate securities in those markets into negative territory.
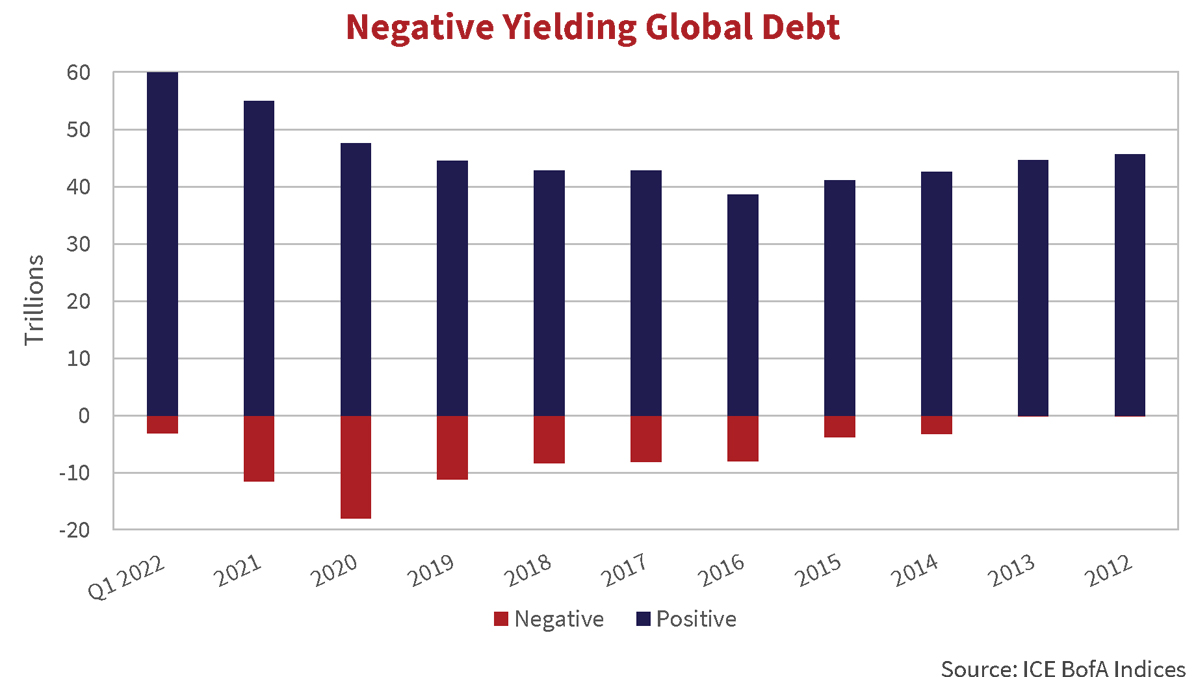
Per the chart above, in 2020, yields on $17.9 trillion of the $65.5 trillion debt included in the ICE Global Broad Market Index were negative. As of March 31st, 2022, that number had reduced to $3.3 trillion. Of the $3.3 trillion, Japan accounted for $2.1 trillion (2020 $5.1 trillion) or 71% of negative yielding debt outstanding, and Europe $828 billion (2020 $11.3 trillion) or 27%. The yield on the Index rose to 2.05% at March 31st from 0.57% at December 31st, 2020.
The Bottom Line
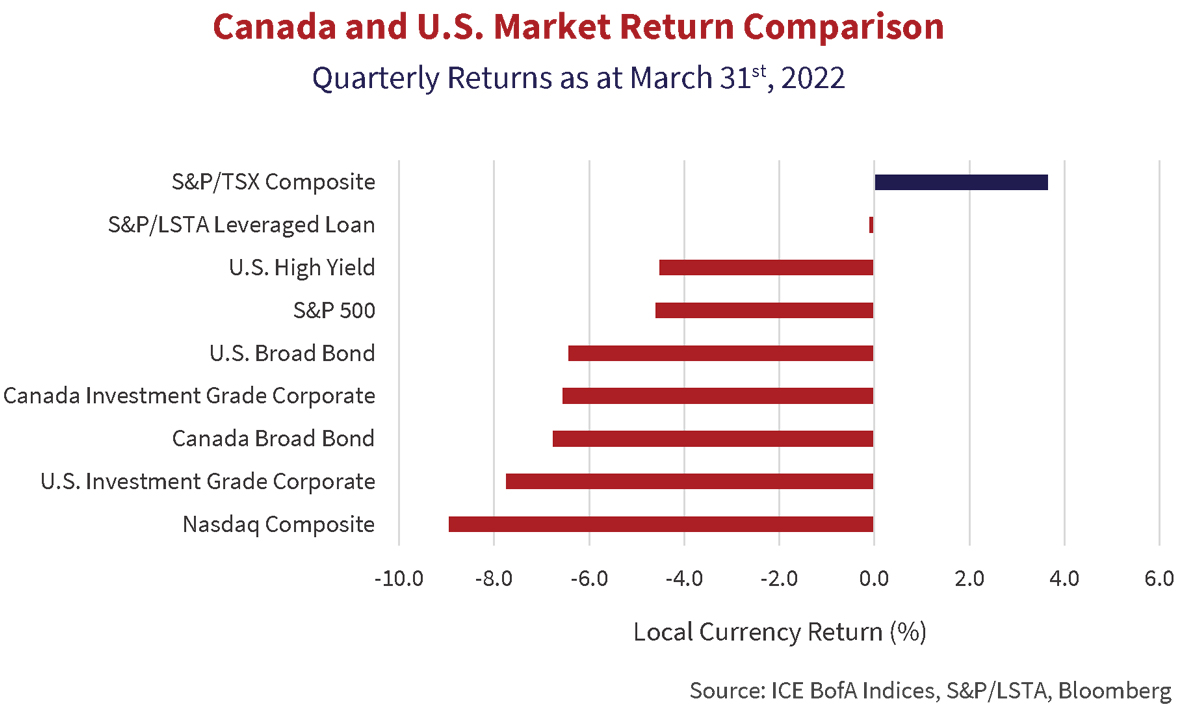
Rising bond yields decimated financial markets in the first quarter of 2022. The chart below highlights the near universal carnage in equity and bond market returns. The lone standout, the commodity heavy Canadian S&P/TSX Composite. The floating rate leveraged loan market in the U.S. was slightly negative as demand from yield starved investors fleeing fixed rate bonds anchored prices. The Nasdaq suffered the largest defeat, down 9.0%, with higher quality, longer duration bond markets not far behind.
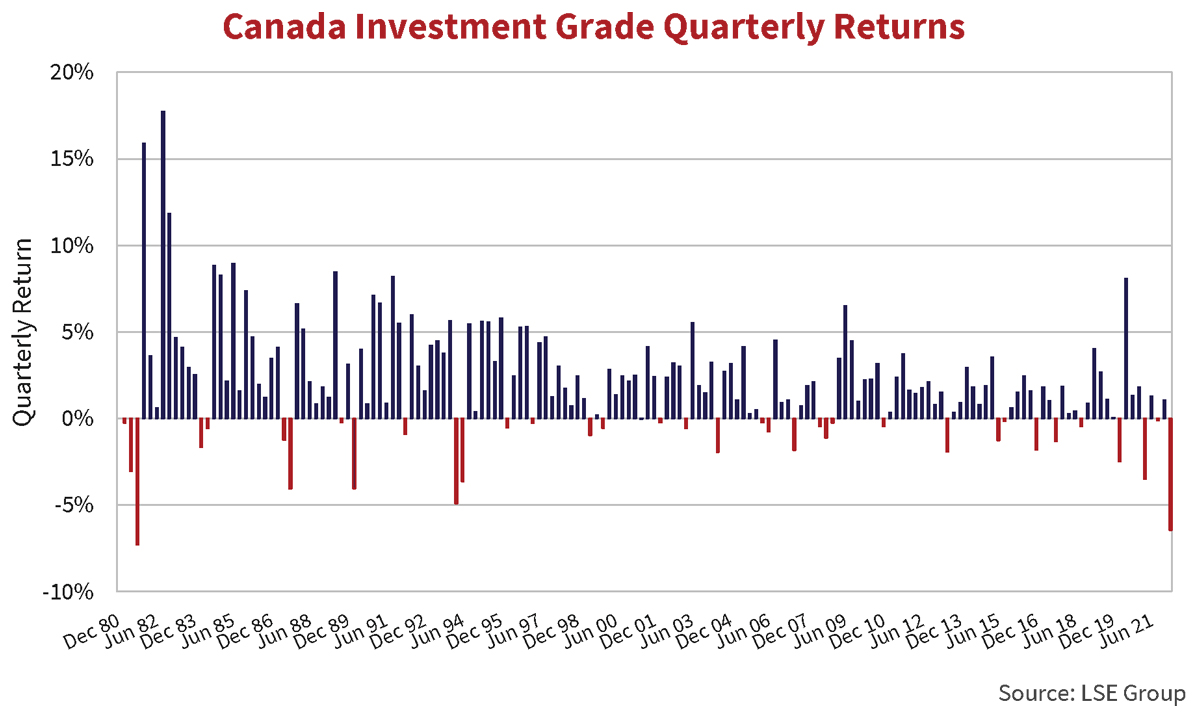
The Canadian corporate bond market recorded its second largest drawdown on record in the first quarter of 2022. The chart below shows quarterly returns for the FTSE Canada Corporate Bond Index dating to 1981. The negative 6.5% first quarter return ranks behind only the negative 7.3% drawdown in the third quarter of 1981.
The longer duration Canadian Broad Index fared worse generating a negative 6.8% return. There was no place to hide in fixed income. Even investors seeking safety and capital preservation in short term bonds found no refuge. Rising yields resulted in the ICE BofA Canada Short Term Corporate Index falling -3.6% in the quarter. This was ahead of the Canada Mid Corporate at -7.1% and Canada Long Corporate at -10.7%.
Changes In Latitudes
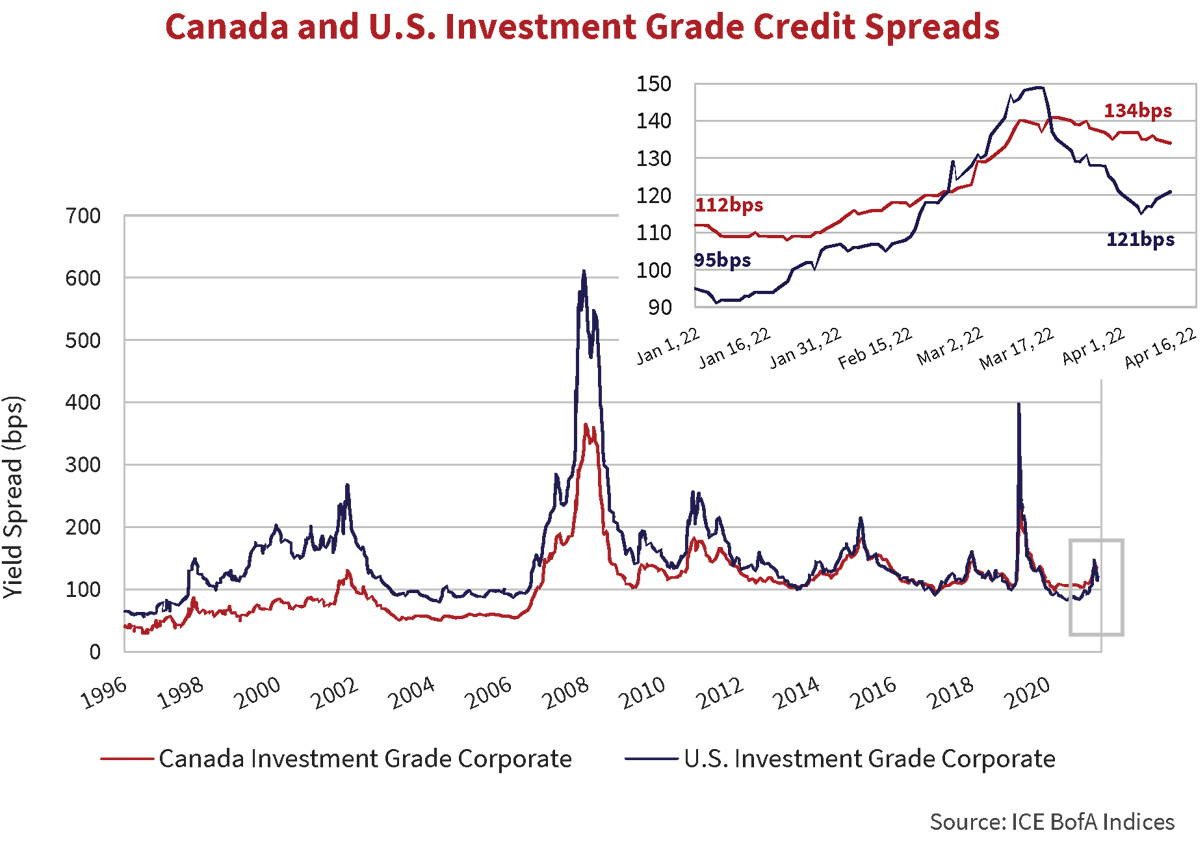
Investment grade credit spreads in Canada and the U.S. provided no cushion against rising government bond yields. Widening credit spreads instead pushed yields and losses higher. In Canada, spreads widened 25 basis points over the quarter. In the U.S., spreads proved more volatile, exceeding Canadian levels for a period in March, before rallying into quarter end to finish 26 basis points wider. Both markets absorbed significant new issue volumes. Issuers accepted new issue spread concessions as the price of locking up still inexpensive capital ahead of further monetary tightening.
Off to the Races
Canadian investment grade new issuance ended the quarter at a blistering pace. High quality Canadian corporates issued a record $30 billion of new supply in March. Year-to-date issuance totaled over $46 billion, 40% higher than the first quarter of 2021. Financials dominated, accounting for over three-quarters of all bonds issued. Rogers Communications brought the largest non-financial issue, raising $4.25 billion as partial financing of their pending acquisition of Shaw Communications.
Canadian bank AT1 issuance continued in March. Bank of Montreal came to the market with its second Limited Recourse Capital Note. BMO raised $750 million at a spread of 403 basis points, wider than the 394 basis point spread on its original issue in September 2020. TD Bank issued $850 million of an institutional preferred share. The preferred share pays a semi-annual dividend at the rate of 5.75% for the first 5 years and then resetting at 332 basis points above the prevailing 5-year government of Canada yield.
Changes In Attitudes
High yield bonds declined for much of the last quarter in the face of rising bond yields, widening spreads, and outflows from the asset class. The ICE BofA High Yield Index reached a low of -6.3% on March 15th before rallying into quarter end. Despite the late recovery, the high yield market finished the quarter with a -4.5% return. Single B bonds outperformed at -3.5%, with CCC returning -3.7%, and the higher quality and longer duration BB segment returning -5.4%. Supported by surging oil prices, energy related issues outperformed on a relative basis but were also negative.

The graph above highlights the movements of high yield credit spreads this year. In mid-March spreads stood 107 basis points wider, then rallied to finish 62 basis points wider at quarter-end. Viewed over the long-term, the current 392 basis point spread does not represent a compelling buying opportunity. We remain concerned over risks derived from current valuations and see limited upside in all but a select few high yield opportunities.
Nothing Remains Quite the Same
Unlike investment grade markets, high yield saw limited new issuance in the first quarter. Increased spread volatility and reduced appetite for risk kept high yield investors skittish and issuers on the sidelines. JP Morgan reported first quarter high yield issuance of USD $46.5 billion, down 71% from USD $158.8 billion one year ago. Rising all-in yields and wider spreads reduced opportunistic refinancing. Just 47% of new issuance proceeds were refinancing related, down from an average of over 60% in the last 5 years.
According to JP Morgan, credit rating upgrades resulted in $40 billion in high yield debt moving back into investment grade indexes over the quarter. Among these rising stars were Continental Resources, Inc. ($6.4 billion face value of index debt), Freeport-McMoRan Inc. ($7.3 billion) and The Kraft-Heinz Company ($17.1 billion). Credit quality improvements propelled by low borrowing costs, government stimulus, and consumer demand lead to the credit rating upgrades. No downgrades occurred of investment grade rated companies to high yield in the latest quarter. Compare this to 2020 when rating downgrades of corporate debt pushed $223 billion into fallen angel status.
High(er) Yields
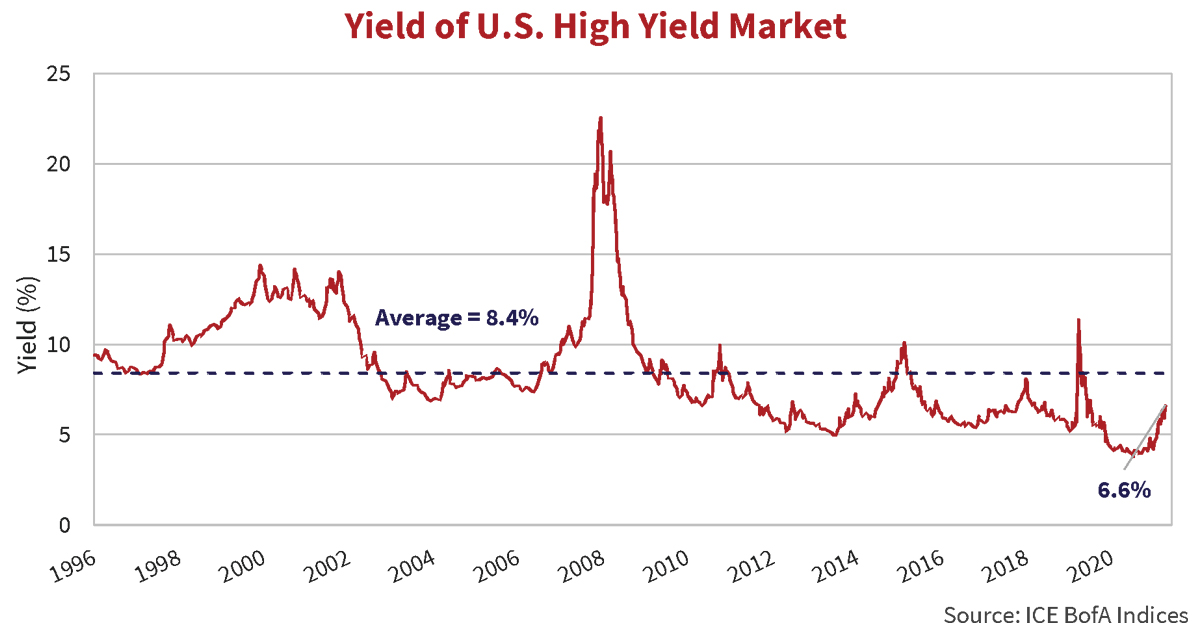
Higher “yield” in the non-investment grade market is the result of rising government bond yields and credit spread widening. The graph below shows the yield of the ICE BofA High Yield Index. After falling below 4% for parts of 2021 the yield closed above 6% at the end of March 2022.
In 2021, and early in 2022, many issuers opportunistically completed refinancings, taking advantage of historically low financing costs. At March 31st, 12% of outstanding high yield issues carry coupons of 4% or below, while 33% pay coupons of 5% or below. In the current higher yield environment, these low coupon securities, purchased at new issue, are less attractive. Investors who reached for yield in these issues have endured falling prices as coupons fall well below current market levels.
Royal Caribbean tapped the market in early 2022, issuing USD $1 billion, with a 5.5 year term and a 5.375% coupon. By mid-March, rising government bond yields and widening credit spreads dropped the price to $91, though the issue rallied to close at $95.61 on March 31st. Investors who reached for yield in the lower coupon refinancing of yet another pandemically affected issuer are not off to a good start.
Suspicious Minds
The leveraged loan market was the top performing segment within fixed income in the first quarter. The S&P/LSTA Leveraged Loan Index returned -0.1%. While still negative, on the surface, this is a decent performance on a relative basis compared to other fixed income markets. Proponents of leveraged loans tout the benefits of floating rate coupons and 1st lien security. Those features, coupled with lighter new issuance, explain leveraged loans stronger performance. However, we remain cautious on this market due to the underappreciated amount of credit risk, the likelihood defaults will rise along with interest rates, and the reduced protections afforded by weakened covenant structures which will reduce recoveries in default scenarios.
Where Angels Fear to Tread
Companies, countries and individuals are starting to bear the cost of higher administered rates and rapidly rising bond yields in the face of decades high inflation. The withdrawal of quantitative easing means less money in the economy. Higher borrowing costs and tighter credit conditions reduce economic activity. In the background, the conflict in Ukraine, China’s real estate industry restructuring, and the enduring Pandemic, each cast a shadow over financial markets. In this environment, we are placing a premium on liquidity – favouring high quality, floating rate corporates and Government of Canada bonds or U.S. Treasuries. The temptation to reach for yield is always there but this is not the time.