

The Hour Between Dog and Wolf
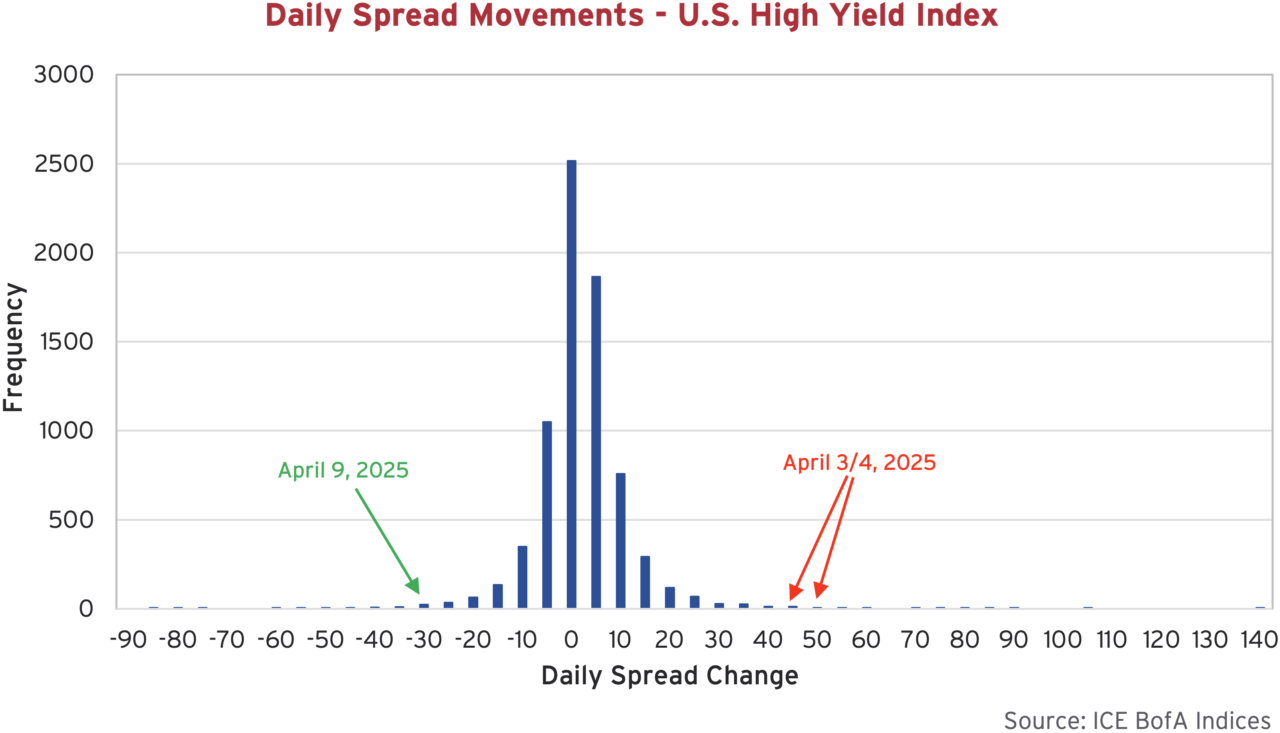
To illustrate the turmoil that has characterized the last three weeks, below we plot the daily movements in high yield credit spreads dating back to 1997. Of little surprise, on the vast majority of the 7,000+ trading days plotted, spread movements of the high yield index are close to zero. In the weeks following “Liberation Day”, we can see things were quite different. High yield credit spreads experienced historically large swings, in both directions. As we try to make sense of this period of uncertainty and volatility, we are reminded of a quote from a Canso favourite, The Hour Between Dog and Wolf, that feels apt:
“It has been said of war that it consists of long stretches of boredom punctuated by brief periods of terror, and much the same can be said of trading.” John Coates, The Hour Between Dog and Wolf.
It has been a whirlwind start to Trump’s second presidential term. Well ahead of his 100 day report card, the U.S. President’s speed of execution on policy priorities has taken many by surprise. The old world order has been rocked with huge geopolitical and economic implications as the Trump Administration is targeting both friend and foe with tariffs. The total scale, breadth and duration of the Trump Tariffs remains uncertain, but the risk of recession is certainly higher than it was, as growth and employment outlooks deteriorate.
Ease Up
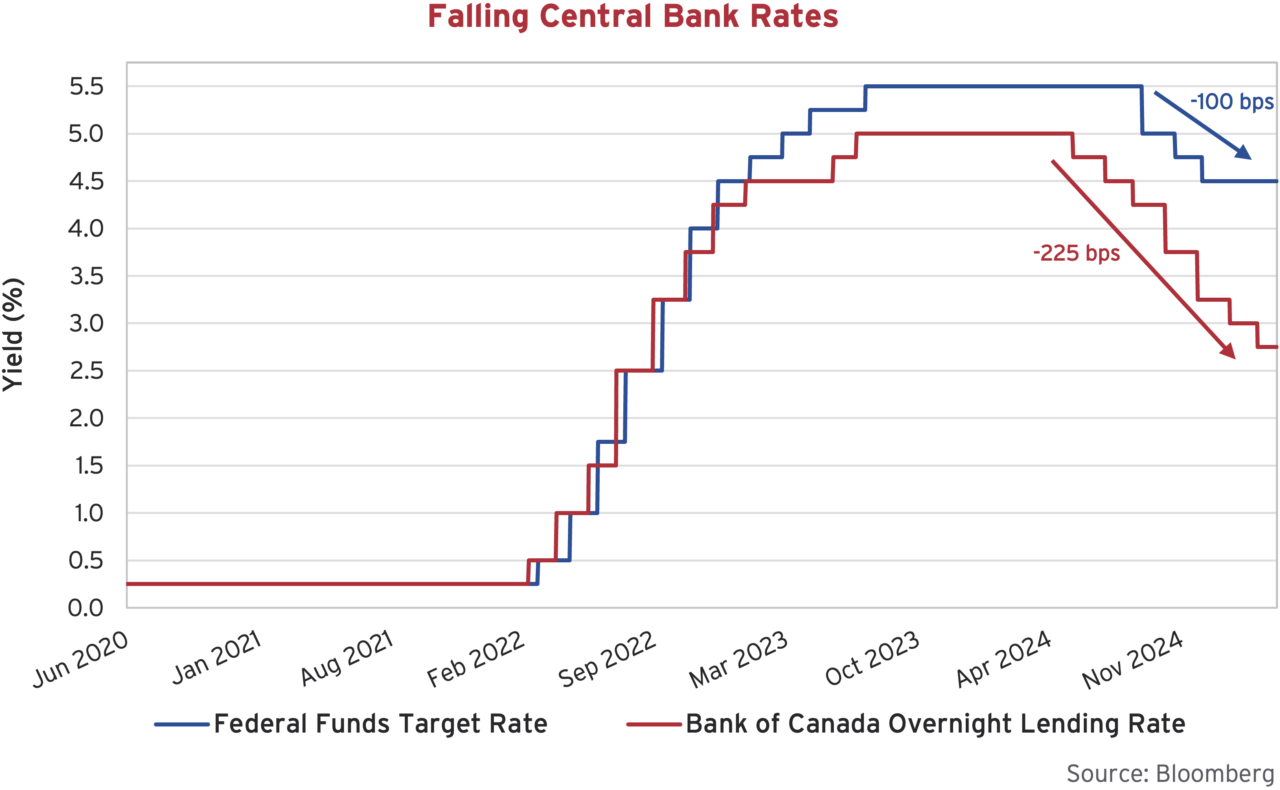
The Bank of Canada (BoC) continued its easing cycle in 2025, with back-to-back 25 bps rate cuts in January and March, leaving the policy rate at 2.75%. BoC cut in 7 consecutive meetings before moving to a “wait and see” posture in April, but will likely continue to cut before the year is finished. The Federal Reserve (Fed) on the other hand has been much more measured in this easing cycle, cutting a total 100 bps compared to Canada at 225 bps over the last year. Both the Bank of Canada, the Fed, as well as their global counterparts, will be challenged in determining the appropriate path for rates in what could be an evolving stagflation environment.
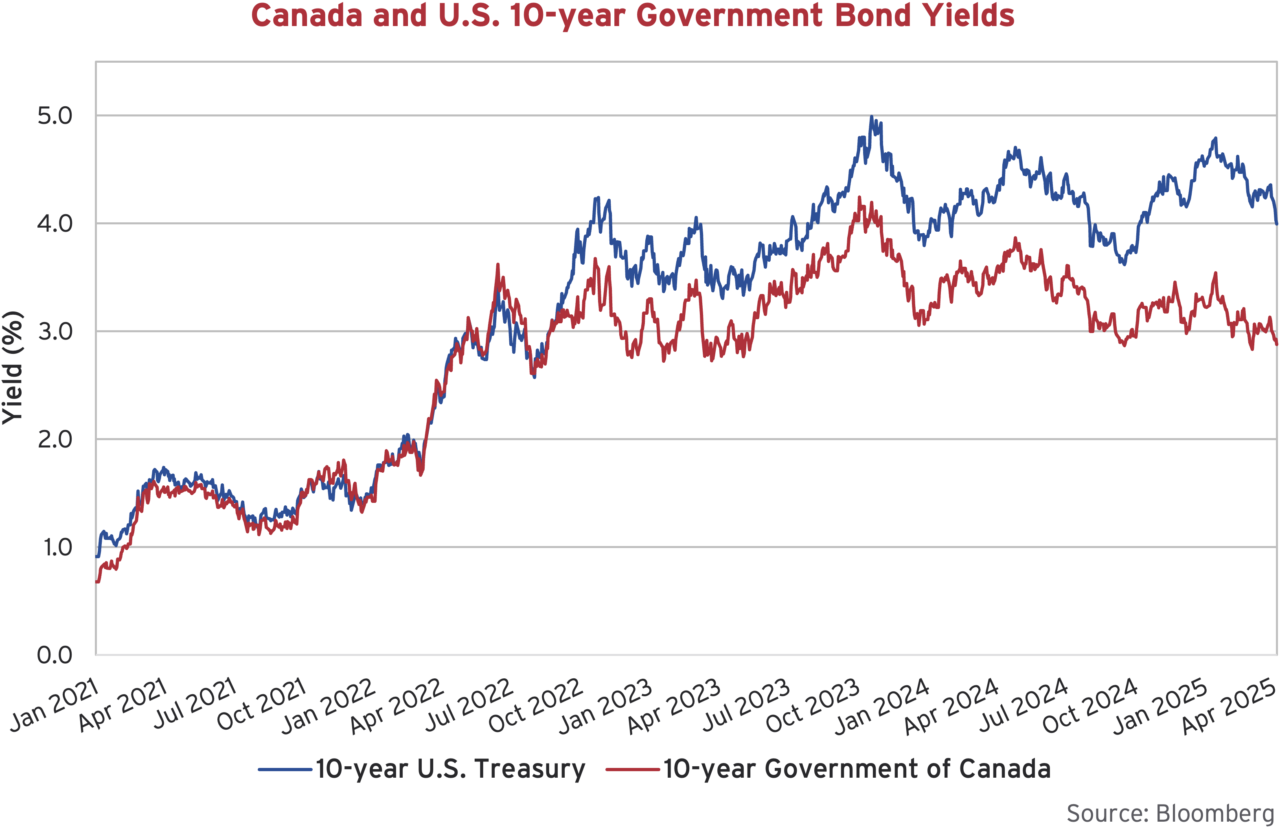
As we wrote in the January edition of our Corporate Bond Newsletter, the relative aggressiveness of Canada’s cuts has contributed to a significant widening between U.S. and Canadian government bond yields. The basis between the two continues to persist at historically wide levels. Below we have plotted the 10-year Government of Canada bond yield alongside the 10-year U.S. Treasury yield. Through most of this year, yields fell as investors found comfort in government bonds through the policy uncertainty. The U.S. 10-year eventually crept below 4% before the fall out from the April 2nd “Liberation Day” announcement. In the aftermath, investors began selling off longer dated U.S. Treasuries sending yields higher.
Elbows Up
Canada has found itself in the crosshairs of chaotic U.S. trade policy. Attacks on our industry and sovereignty have left a bitter taste in Canadians’ mouths. According to OAG Aviation, forward airline bookings from Canada to the U.S. for travel this summer are down 73% year over year. The attacks emanating from our southern neighbour are occurring in the midst of the Canadian Federal election. Canadians who were previously focused on a domestic housing crisis, sluggish economy and the rising cost of living are now fully locked in on this country’s response to the U.S. trade war. This has helped the Liberals recover a 20-point deficit in the polls in a matter of weeks.
A positive byproduct of the attacks, in our view, is that they are strengthening Canadian unity. In addition to still being the greatest hockey nation on Earth (thanks Connor McDavid), we are a resource rich country with a highly educated population, stable political system and adherence to the rule of law. The near-term will be difficult, as industries recalibrate and household balance sheets necessarily de-lever, but we are proud to be Canadian and positive on the resilience and long-term prospects of our country.
The Bottom Line
Financial market performance in the first quarter of 2025 reflects due concern with stocks experiencing their worst start to a year since 2022. After hitting record highs to start the year, the ratcheting up of tariff threats triggered a repricing of risk assets and equities slid into correction territory. Fixed income proved to be a “safe haven” in the quarter, with falling government bond yields pushing bond prices higher and providing a welcome respite. The gains from lower yields were partially offset by the negative impact of widening credit spreads alongside the repricing of risk assets. Lower quality corporates with higher default risk felt the largest impact and caused the high yield index to underperform.
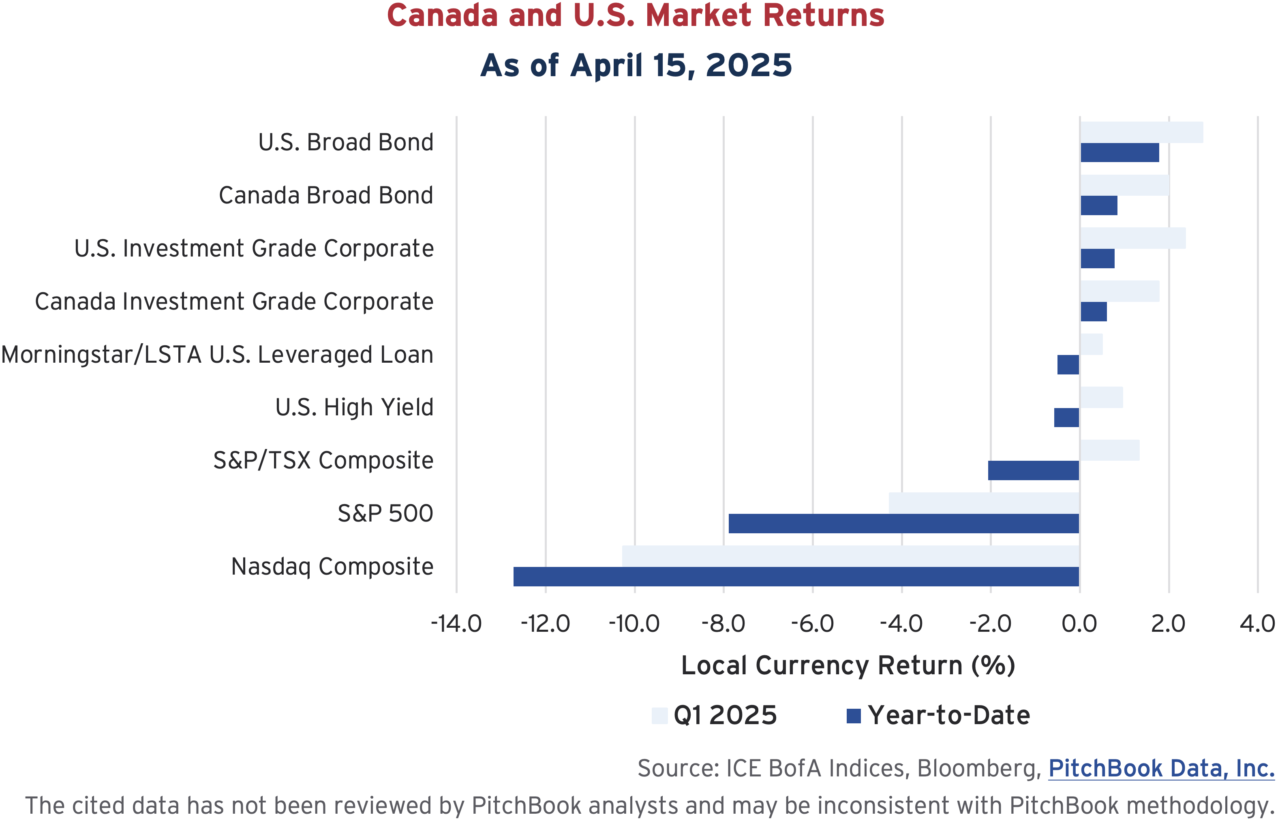
While both value and growth stocks have declined sharply, growth stocks did particularly poorly with the “Magnificent Seven” tech stocks suffering their worst quarter on record. Tesla was the worst performer amongst the group of seven, down 36% in the first quarter as sales declined amid protests against CEO Elon Musk’s involvement in the Trump Administration. This saw the Nasdaq significantly underperform the S&P 500, while Canada’s S&P/TSX Composite Index has held up best thanks to its greater weight in resource-related sectors and lower exposure to the tech sector.
In the two weeks since quarter end, equity markets are lower still as investors digest the likely impacts of reciprocal tariffs, room for concessions, and the escalation of U.S.-China tensions. In the bond market, yields have changed course and are now decidedly higher in both Canada and the U.S. The graph of Canadian and U.S. 10-year yields above illustrates this move. Stated explanations for the retreat from the “safety” of bonds have ranged from hedge funds and large institutional investors unwinding positions, to theories of nefarious transactions by foreign governments. Perhaps the simpler answer reflects the prospects for higher inflation and increasing deficits. Either way, fixed income markets are now just barely keeping their heads above water.
Corporate Action
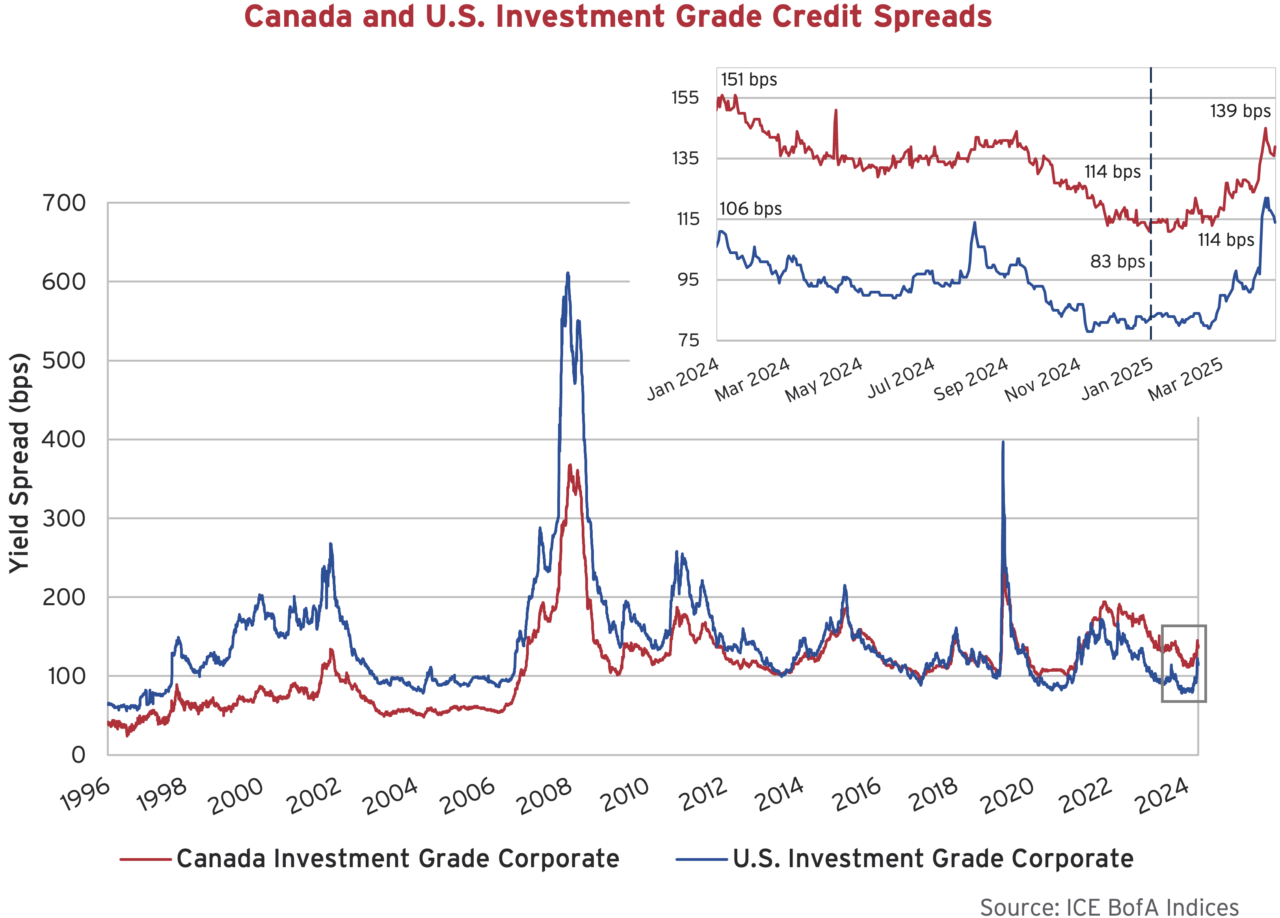
Within investment grade corporate bond markets, the movement in credit spreads has been relatively muted compared to the volatility being experienced across other markets. During the first quarter, investment grade spreads widened 13 bps in Canada and 15 bps in the U.S. Since then, investment grade spreads in the U.S. have widened an additional 16 bps, while the Canadian market has been slower to reprice with just 12 bps of widening across the index. Spreads are comfortably off the lows and are now hovering around where they were this time last year.
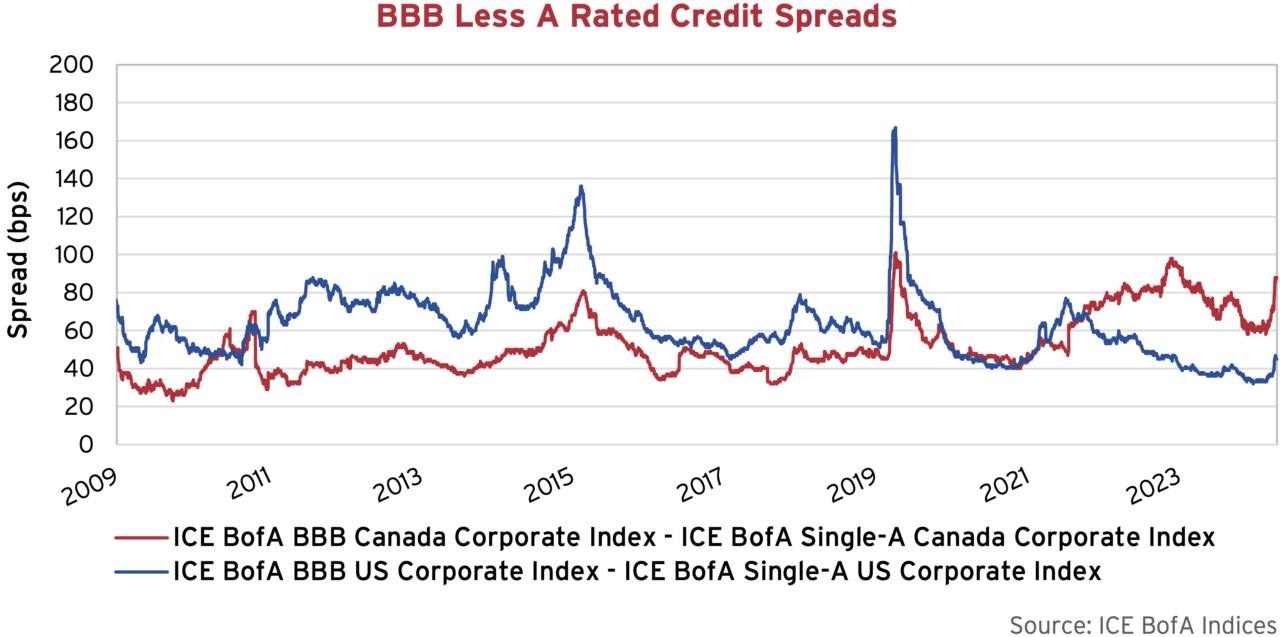
If we dig deeper within the investment grade index in Canada and the U.S., we can see that the sell off across risk assets is only starting to translate into wider spreads for lower rated BBB bonds. Credit spreads in investment grade have performed well relative to other risk assets. The graph below plots the basis between credit spreads in bonds rated BBB and bonds rated A within both markets. In the U.S., the basis has increased modestly by about 10 bps and is not yet comparable to other periods of credit stress, while in Canada, the move has been more decisive at closer to 30 bps. Within Canadian investment grade, the inclusion of Limited Recourse Capital Notes (LRCN) has had a significant impact on this widening. If we remove the impact from LRCNs, the Canadian spread would be much more in line with the U.S. market.
Continuing to Reset Expectations
In our last newsletter we highlighted LRCNs as a top performer in 2024. So far in 2025, things have gone the other way. As a reminder, this junior ranking debt, issued by Canadian banks and insurance companies, ranks below senior and subordinated bonds, in line with preferred shares. Within this subsegment, there is a marked difference between the performance of “low reset” issues versus “high reset” peers. Below we have updated our graph on the relative performance of these LRCNs.
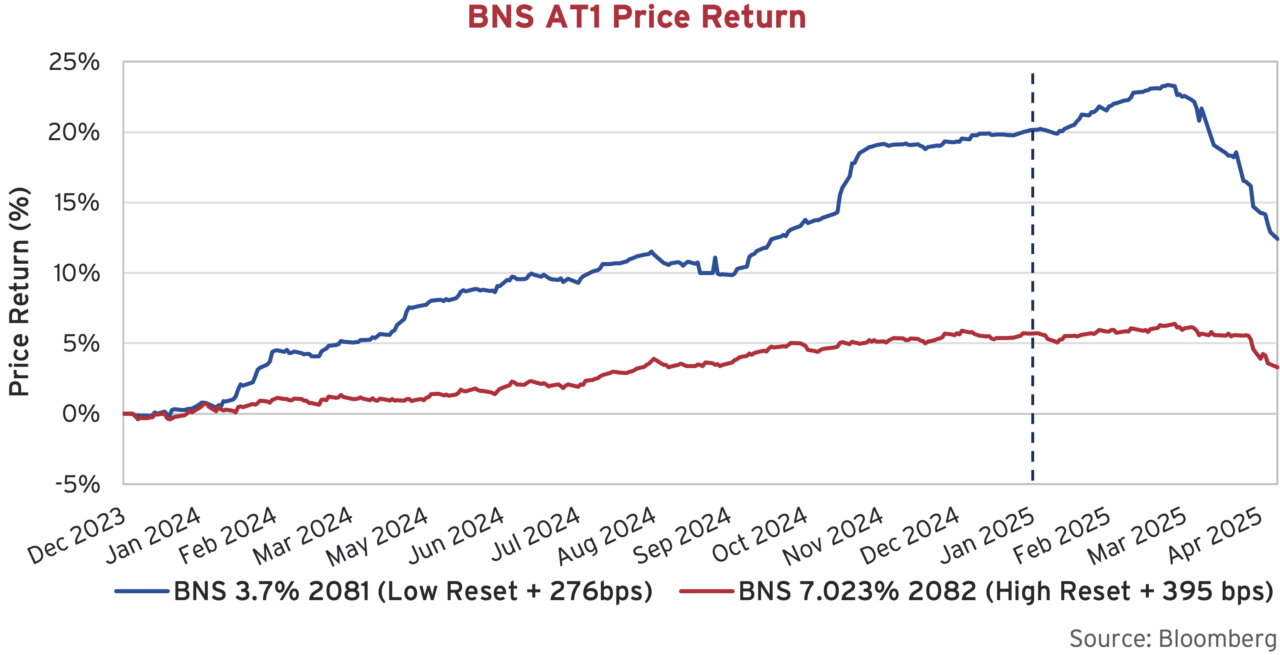
The typical structure of a Canadian LRCN is “60 non-call 5”, or “60 years to final maturity, but callable at par once every 5 years”. An important feature of these securities is the “reset spread”. Every 5 years, the issuer has the option to either call the bond at par, or, reset the coupon at the then prevailing 5-year GOC rate plus the “initial credit spread” (or “reset spread”). If the initial credit spread was high (“high reset”), the bank or insurance company is more likely to call the security when able to. If the initial credit spread was low (“low reset”), the issuer is less likely to exercise its call option, and the security will remain outstanding.
Since they began being issued, we have seen “high resets” price at 400 bps and above, and “low resets” price at 300 bps and below. The problem the “low reset” LRCNs face is that as credit spreads widen, it reduces the likelihood these issues will be called on their reset date. As a result, they can trade as longer dated bonds with much more price volatility. As credit spreads tightened throughout 2024, the probability of these “low reset” LRCNs being called increased, marching their prices back up. The inverse has been true so far in 2025.
Telco Hybrid Bonanza
Two new issuers entered the hybrid bond market in the first quarter. Canadian telecom powerhouses Rogers Communications and Bell Canada pulled on new financing levers with their inaugural issuance of Canadian hybrid securities. On February 10th, Rogers issued a blockbuster three-tranche, cross-border hybrid transaction that included C$1B and US$2.1B of subordinated notes, each due in 2055. A couple of days later, Bell Canada followed suit with a US$2.25B deal of the same structure and later followed up with a C$1.25B offer in March.
The Canadian tranches of the deals were both priced with coupons of 5.625%, which we estimate is about 0.5% higher than the telcos would have paid for long-dated senior unsecured issuances. Despite their higher servicing cost, the hybrid deals are attractive to Bell and Rogers due to a little dose of “financial engineering”. From a rating agency perspective, the hybrid securities provide flexibility to the issuers as only 50% of the par amount is classified as “debt” when calculating their leverage metrics while the other 50% is looked upon as equity. This is in consideration of the fact that the securities combine features of both debt and equity, ranking in between senior debt and equity in the capital structure.
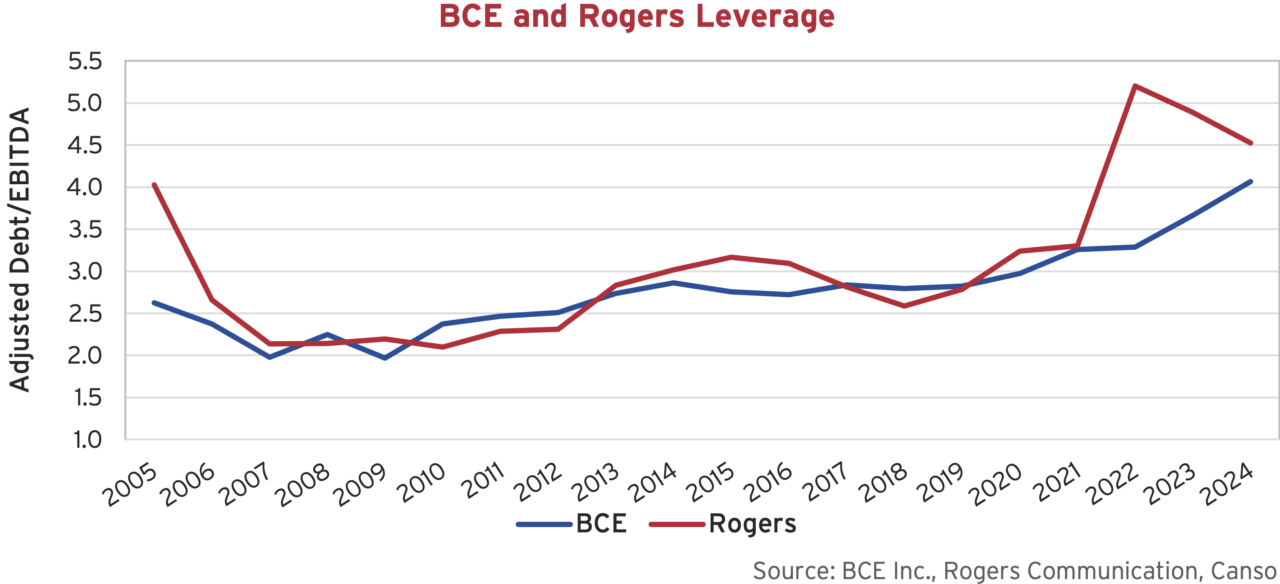
The 50/50 treatment is attractive as these companies work to contain their leverage ratios in an industry where competition is rising and growth is moderating. Bell’s troubles stem from high spending on capital expenditures and a large dividend payment that management remains committed to. In addition, the company made an ambitious bet on the U.S. market last November with its C$7B acquisition of Washington-based internet provider, Ziply Fiber.
Rogers, we would argue, has been even more aggressive in their growth aspirations. Following the company’s C$26B acquisition of Shaw in 2023, leverage jumped above 5x. Despite having promised to bring this number down through synergies and “best behaviour”, the company continues on a spending warpath with the sports industry a primary focus. After announcing the acquisition of Bell’s 37.5% stake in Maple Leaf Sports & Entertainment Ltd for C$5B last September, the company now boasts a renewed deal for the NHL rights across Canada. The new C$11B deal more than doubles the previous price tag and will provide Rogers the national media rights across all platforms in this country over the next 12 years. Before the ink could dry on the NHL deal, the company’s wholly-owned Toronto Blue Jays penned their star first-baseman to a 14 year, US$500M contract. We hope Vladdy negotiated an NHL subscription into his contract!
Risk-y Premiums
The repricing of default risk has been more pronounced among high yield issuers, as investors contemplate the impact of tariffs on lower quality borrowers. The graph below plots the credit spread of the U.S. High Yield index. High yield spreads moved 65 bps wider in the first quarter, and as we pointed out at the outset, they have since seen historically large daily moves. Credit spreads have netted out another 51 bps wider at the time of writing.
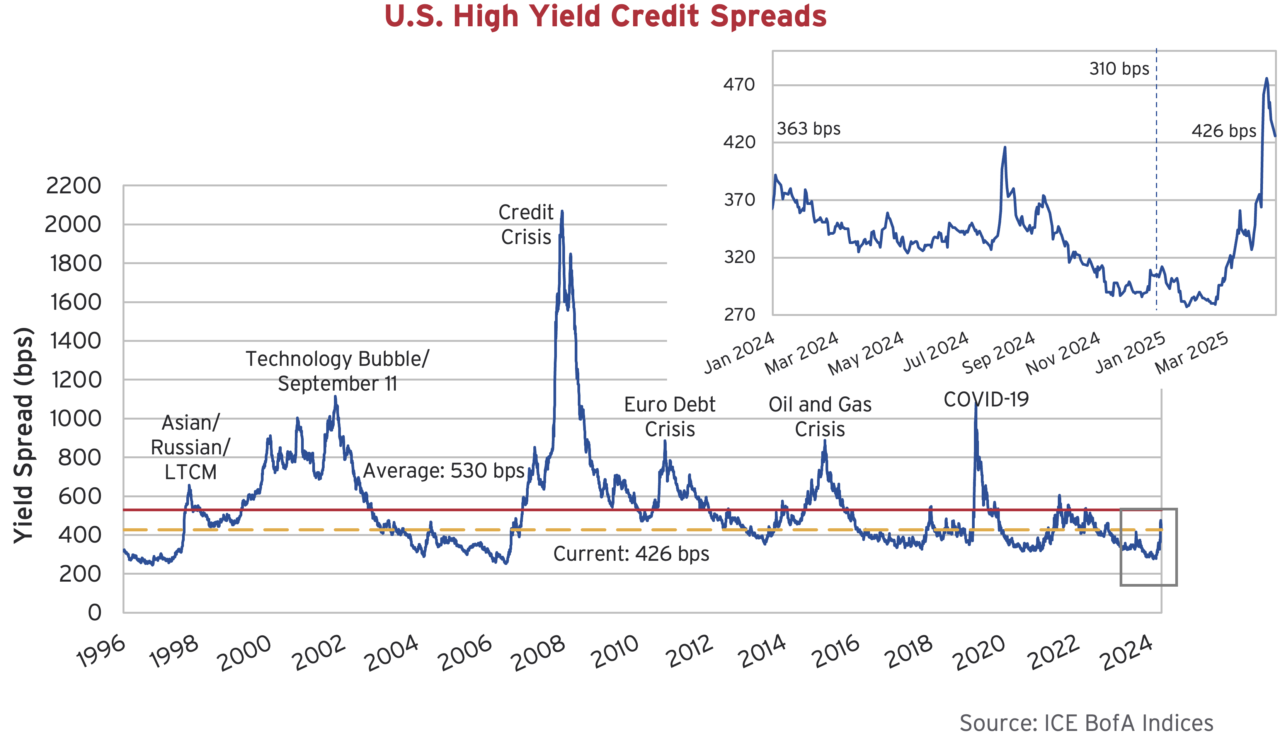
At the time of writing, the credit spread of the U.S. high yield index sits at 426 bps. Spreads remain 100 bps inside the historic average of the index and are not yet at crisis-level valuations. The sharp move wider seems to be enduring off the lows given the market uncertainty and trace back to levels last seen at the end of 2023. While the market has moved to catch up to increasing default risk and uncertainty, valuations in aggregate are not yet screaming value. Given how volatile things have been, that could change quickly, and we are eagerly waiting for more compelling opportunities.
Feedback Loop
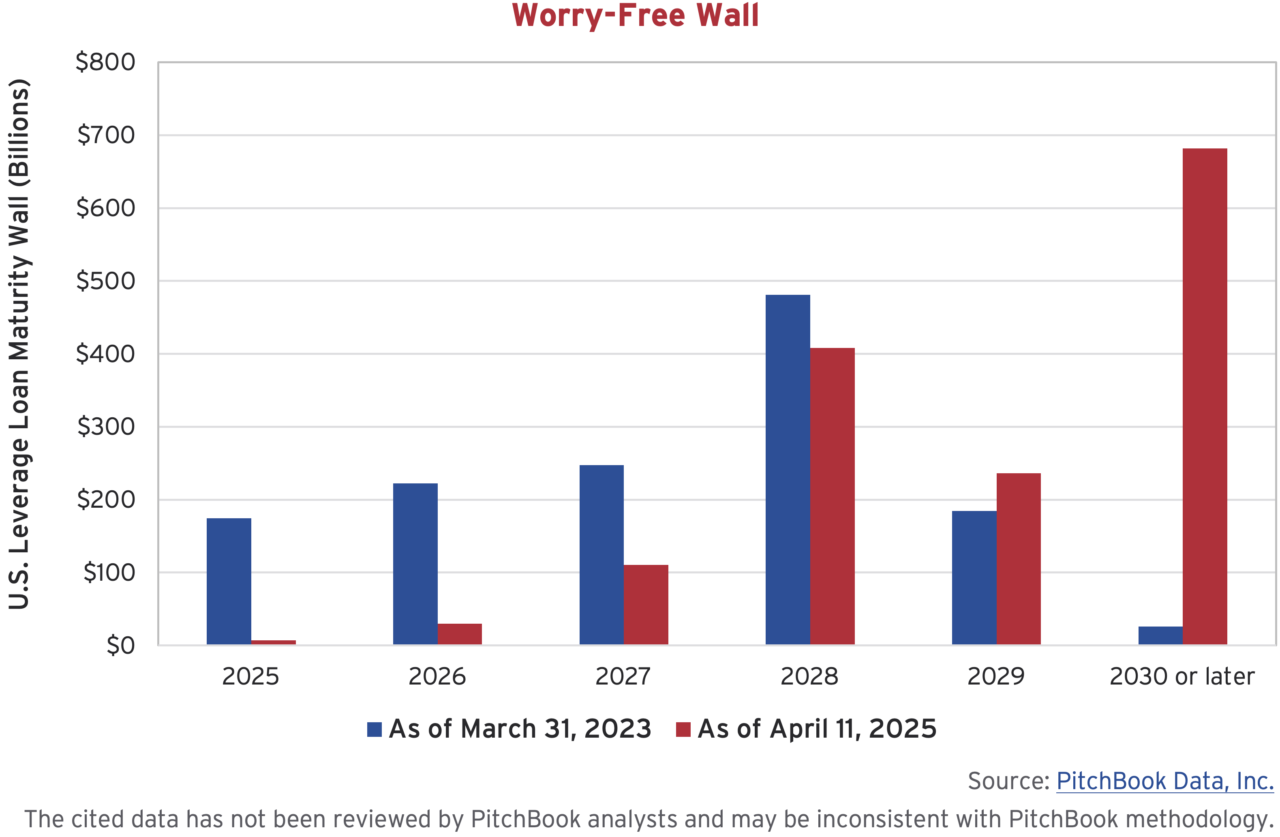
The high yield market continues to find optimism in low default rates supported by significant refinancing activity over the last year. The “Wall of Worry” so often talked about in 2022 and 2023 has officially been surmounted as issuers have successfully pushed out maturities. New issuance levels in 2025 continued at a torrid pace in January and February before leveling off in March and all but shutting down in April as uncertainty crept into the market picture. Canadian investment grade issuers placed $38B of newly issued debt into the market in the first quarter of 2025 while U.S. investment grade companies borrowed $500B, both in line with 2024 levels. In speculative grade markets, levered loan issuance remained strong, rising 8% to $355B, while high yield bond issuance declined 20% to $68B.
Investors continue to clamour for Collateralized Loan Obligations (CLOs) which is supporting the pipeline for new issue levered loans. CLO managers have a mandate to deploy investor capital into the loan market and have been doing so with abandon. Investors poured $49B into CLOs in the first quarter of 2025 and close to $200B into the asset class over the past 12 months. The levered loan market remains full of issuer friendly deal structures, which we believe remains an underappreciated risk to investors. Weak structures have resulted in the increase in liability management transactions by issuers that can drastically weaken the collateral that supports the recovery of an issue. We believe this remains an environment where discriminate active management is needed to assess downside risk, but also to identify actual value opportunities amongst the volatility.
One Way Train
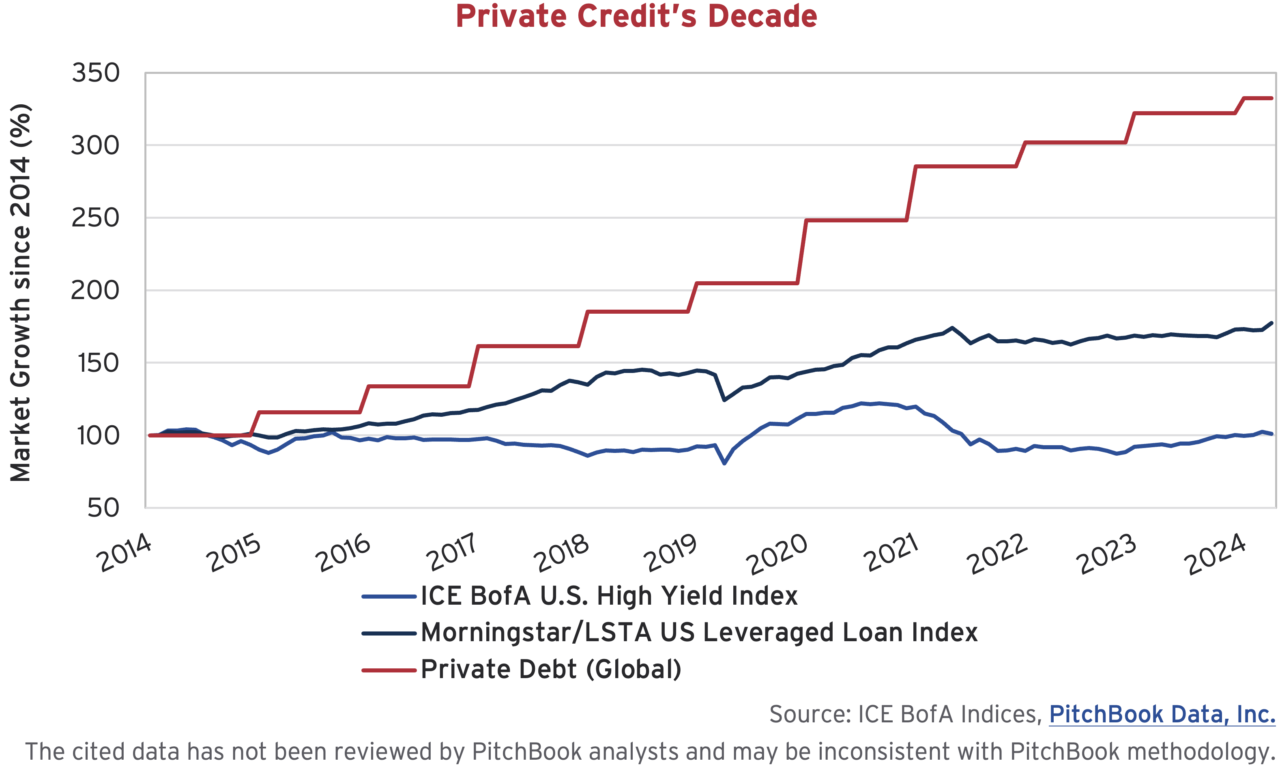
We take a moment to zoom-out and examine the growth of the corporate credit markets over the past decade. Predictably, the primary markets of interest (to us at least) are much larger today than they were 10 years ago. We can see in the table below that the Canadian Investment Grade market has grown 40% over this time period, from $417B to $581B. Meanwhile, the U.S. Investment Grade market and Below Investment Grade markets as a whole (including high yield bonds, levered loans and private debt) have each grown 70%.
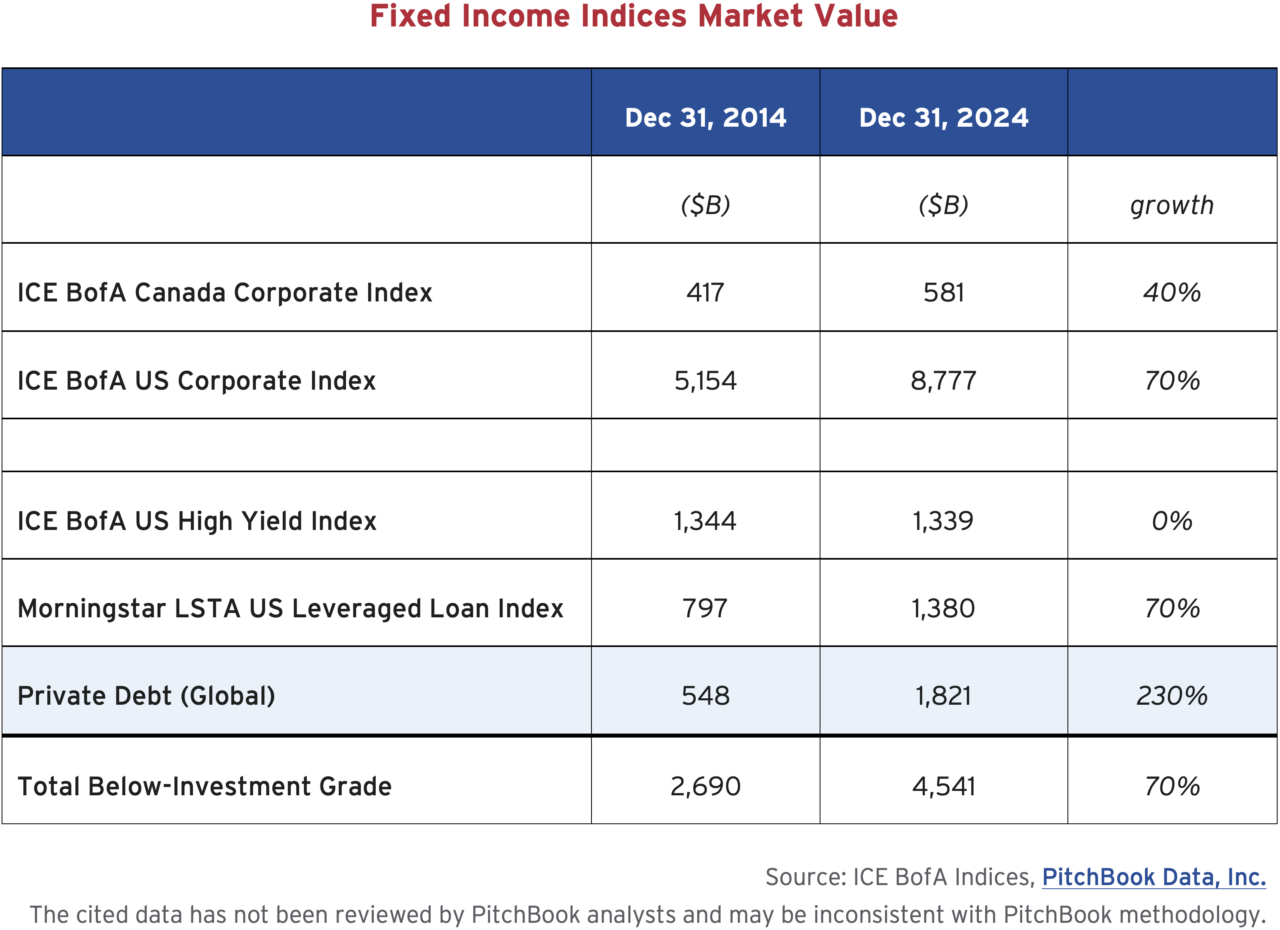
Although these high level growth numbers are not too dissimilar, the make-up of the growth within the Below Investment Grade markets jumps off the page. It is amazing to see that the U.S. High Yield Bond Index ended 2014 with a market value of $1.34 trillion and 10 years later it is sitting at the exact same $1.34 trillion figure. Zero growth in this market over the past decade despite growth in the economy and a continued appetite for leverage is very surprising. Of course, a major story in recent years has been the rise of private debt. According to Pitchbook, who publishes annual figures, the private debt market has grown from $548 billion to $1.8 trillion to become 3.3x larger over a 10-year period.
Conclusion
We are living through very uncertain times. We often say that trying to forecast macroeconomic variables is a futile exercise, and this is true now more than ever. There aren’t many careers where you can be wrong most of the time and still get paid, but economists are second to weathermen in this regard, and they have an unenviable job to do in this environment. As forecasters scramble to revise their models with each new Truth Social Trump post, we stay true to our investment discipline. We are well positioned with a high quality and highly liquid portfolio, ready to take advantage of more attractive investment entry points when they do emerge. We stand by with patience, discipline and a long term perspective, ready to navigate what lies ahead.